 Global| Mar 05 2003
U.S. Light Vehicle Sales Down Again
by:Tom Moeller
|in:Economy in Brief
Summary
Unit sales of light vehicles fell sharply in February for the second month. The 4.7% m/m decline followed a steep 11.5% drop the prior month. February sales were slightly below Consensus expectations for a 15.9 mil. unit sales rate. [...]
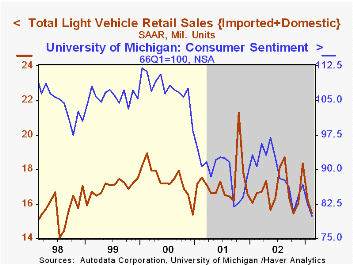
Unit sales of light vehicles fell sharply in February for the second month. The 4.7% m/m decline followed a steep 11.5% drop the prior month. February sales were slightly below Consensus expectations for a 15.9 mil. unit sales rate.
Sales likely were depressed by heavy snowfall across much of the country.
Sales of light trucks rose m/m but car sales fell. Both are off equally y/y.
| Light Vehicle Sales (SAAR, Mil.Units) | Feb | Jan | Y/Y | 2002 | 2001 | 2000 |
|---|---|---|---|---|---|---|
| Total | 15.45 | 16.22 | -7.2% | 16.80 | 17.26 | 17.40 |
| Autos | 7.32 | 8.16 | -7.5% | 8.07 | 8.48 | 8.83 |
| Light Trucks | 8.13 | 8.07 | -7.0% | 8.74 | 8.78 | 8.56 |
by Tom Moeller March 5, 2003
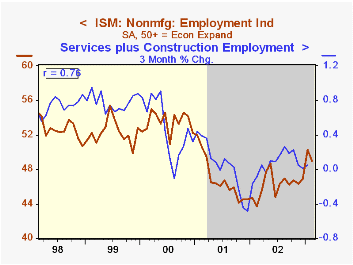
The Institute for Supply Management business activity index of the nonmanufacturing sector fell slightly less than expected last month. Consensus expectations were for a decline to 53.5.
During the last five years, there has been a 65% correlation between the level of the Business Activity Index from the ISM nonmanufacturing survey and quarterly growth in real GDP in the service sector plus structures.
The seasonally adjusted new orders index fell sharply to the lowest level since October.
The employment index also fell but only modestly to 49.0. During the last five years there has been a 76% correlation between the level of this employment index and the three month growth in services plus construction employment.
Business activity for the nonmanufacturing sector is a question separate from the subgroups mentioned above. In contrast, the NAPM manufacturing sector composite index weights the components.
The seasonally adjusted index of prices rose for the fourth month in five to the highest level since January 2001. During the last five years there has been a 61% correlation between the level of this price index and the three month percent change in the CPI for services less rent of shelter.
ISM surveys more than 370 purchasing managers in more than 62 industries including construction, law firms, hospitals, government and retailers. The nonmanufacturing survey dates only to July 1997, therefore its seasonal adjustment should be viewed tentatively.
| ISM Nonmanufacturing Survey | Feb | Jan | Y/Y | 2002 | 2001 | 2000 |
|---|---|---|---|---|---|---|
| Business Activity Index | 53.9 | 54.5 | 57.0 | 55.1 | 49.0 | 59.3 |

Tom Moeller
AuthorMore in Author Profile »Prior to joining Haver Analytics in 2000, Mr. Moeller worked as the Economist at Chancellor Capital Management from 1985 to 1999. There, he developed comprehensive economic forecasts and interpreted economic data for equity and fixed income portfolio managers. Also at Chancellor, Mr. Moeller worked as an equity analyst and was responsible for researching and rating companies in the economically sensitive automobile and housing industries for investment in Chancellor’s equity portfolio. Prior to joining Chancellor, Mr. Moeller was an Economist at Citibank from 1979 to 1984. He also analyzed pricing behavior in the metals industry for the Council on Wage and Price Stability in Washington, D.C. In 1999, Mr. Moeller received the award for most accurate forecast from the Forecasters' Club of New York. From 1990 to 1992 he was President of the New York Association for Business Economists. Mr. Moeller earned an M.B.A. in Finance from Fordham University, where he graduated in 1987. He holds a Bachelor of Arts in Economics from George Washington University.
More Economy in Brief


