 Global| Jul 02 2019
U.S. Light Vehicle Sales Decline
Summary
The Autodata Corporation reported that sales of light vehicles during June edged down by 0.7% (up 0.3% y/y) to 17.28 million units (SAAR). Total vehicle sales have been moving sideways for the past four years at what the auto industry [...]
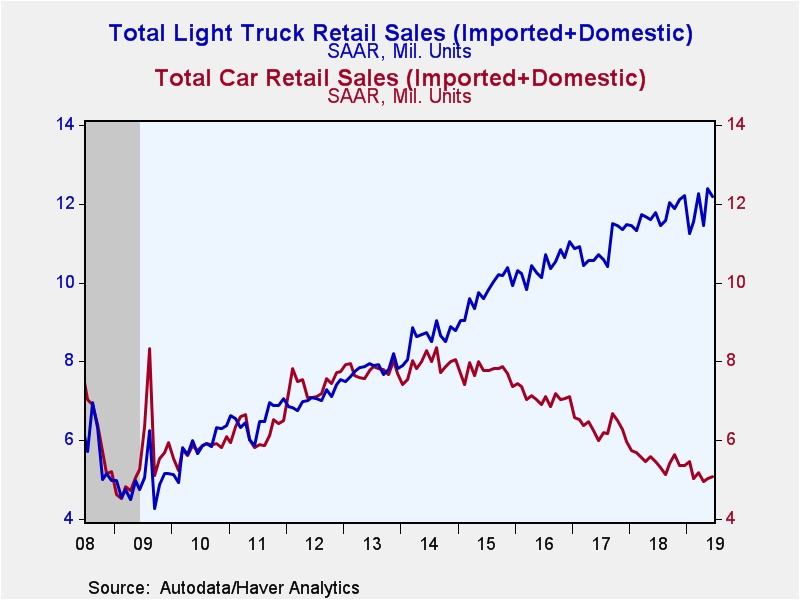
The Autodata Corporation reported that sales of light vehicles during June edged down by 0.7% (up 0.3% y/y) to 17.28 million units (SAAR). Total vehicle sales have been moving sideways for the past four years at what the auto industry considers a solid pace. Today's reading continues that trend.
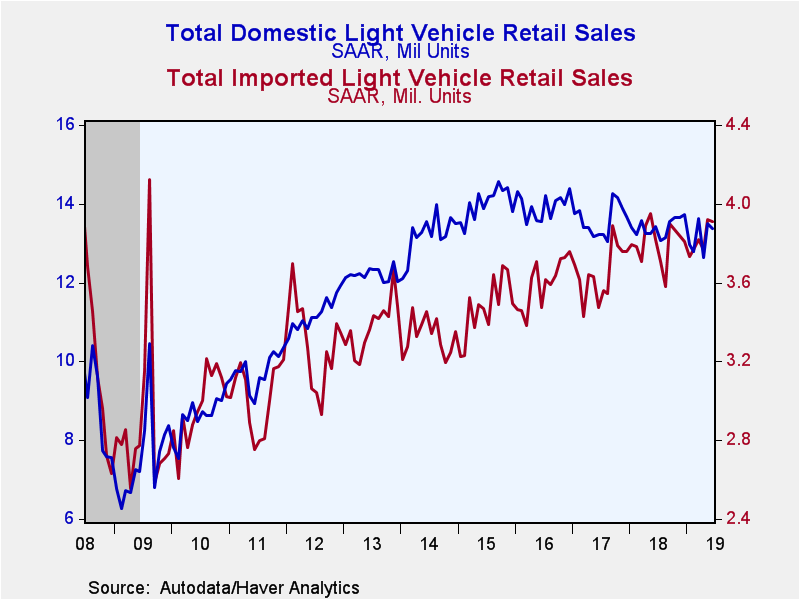
The entire decline was in light-truck sales which fell by 1.5% (increased 3.5% y/y) last month to a 12.19 million unit rate. Truck sales have been on an upward trajectory since the end of the recession, and today's reading does not alter that general trend. Purchases of domestically-made light trucks slipped by 1.2% (up 4.0% y/y) to 9.85 million units, while sales of imported light trucks dipped by 2.9% (up 1.2% y/y) to 2.34 million units. Imported truck sales have roughly doubled in the past four years.
Meanwhile, auto sales increased by 1.4% (down 6.7% y/y) to a 5.09 million unit annual pace. Car sales nevertheless have remained in a downtrend since 2014. Purchases of domestically-produced cars edged up by 0.5% (down 10.6% y/y) to 3.53 million units. Sales of imported cars improved by 4.0% (4.3% y/y), up for the fourth straight month, to 1.57 million units.
Trucks' share of the U.S. light vehicle market has increased steadily since 2014, when gasoline prices plummeted to current low levels. Trucks' share is currently 70.5%, up from 52.5% at the end of 2014.
Imports' share of the U.S. vehicle market was little changed last month, at 22.6% but has been trending upward since 2015. Imports' share of the passenger car market surged to 30.8%, up nearly five percentage points since the end of last year. Imports share of the light truck market eased to 19.2%., but remained up from the 11.8% low in April 2014.
U.S. vehicle sales figures can be found in Haver's USECON database. Additional detail by manufacturer is in the INDUSTRY database.
| Light Weight Vehicle Sales (SAAR, Million Units) | Jun | May | Apr | Jun Y/Y % | 2018 | 2017 | 2016 |
|---|---|---|---|---|---|---|---|
| Total | 17.28 | 17.40 | 16.39 | 0.3 | 17.21 | 17.23 | 17.55 |
| Autos | 5.09 | 5.02 | 4.94 | -6.7 | 5.48 | 6.33 | 7.10 |
| Domestic | 3.53 | 3.51 | 3.53 | -10.6 | 3.99 | 4.58 | 5.20 |
| Imported | 1.57 | 1.51 | 1.41 | 4.3 | 1.49 | 1.75 | 1.90 |
| Light Trucks | 12.19 | 12.38 | 11.46 | 3.5 | 11.74 | 10.90 | 10.44 |
| Domestic | 9.85 | 9.97 | 9.10 | 4.0 | 9.42 | 9.00 | 8.75 |
| Imported | 2.34 | 2.41 | 2.36 | 1.2 | 2.32 | 1.90 | 1.69 |
Peter D'Antonio
AuthorMore in Author Profile »Peter started working for Haver Analytics in 2016. He worked for nearly 30 years as an Economist on Wall Street, most recently as the Head of US Economic Forecasting at Citigroup, where he advised the trading and sales businesses in the Capital Markets. He built an extensive Excel system, which he used to forecast all major high-frequency statistics and a longer-term macroeconomic outlook. Peter also advised key clients, including hedge funds, pension funds, asset managers, Fortune 500 corporations, governments, and central banks, on US economic developments and markets. He wrote over 1,000 articles for Citigroup publications. In recent years, Peter shifted his career focus to teaching. He teaches Economics and Business at the Molloy College School of Business in Rockville Centre, NY. He developed Molloy’s Economics Major and Minor and created many of the courses. Peter has written numerous peer-reviewed journal articles that focus on the accuracy and interpretation of economic data. He has also taught at the NYU Stern School of Business. Peter was awarded the New York Forecasters Club Forecast Prize for most accurate economic forecast in 2007, 2018, and 2020. Peter D’Antonio earned his BA in Economics from Princeton University and his MA and PhD from the University of Pennsylvania, where he specialized in Macroeconomics and Finance.
More Economy in Brief
 Global| Feb 05 2026
Charts of the Week: Balanced Policy, Resilient Data and AI Narratives
by:Andrew Cates


