 Global| Apr 03 2008
U.S. ISM Non-Manufacturing Index Improved Again
by:Tom Moeller
|in:Economy in Brief
Summary
The Institute for Supply Management reported that its Business Activity Index for the non-manufacturing sector improved again in March to 52.2. That was up from 50.8 in February and from 41.9 in January. Consensus expectations had [...]
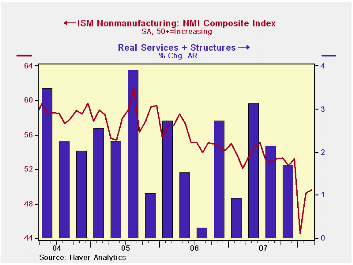
The Institute for Supply Management reported that its Business Activity Index for the non-manufacturing sector improved again in March to 52.2. That was up from 50.8 in February and from 41.9 in January. Consensus expectations had been for a decline to 48.5.
Despite the March rise the index remained near its lowest level since early 2003. A level of 50 is the break even point between rising and falling activity in the service sector.
Since the series' inception in 1997 there has been a 44% correlation between the level of the Business Activity Index in the non-manufacturing sector and the Q/Q change in real GDP for the services and the construction sectors. The correlation of the factory sector ISM index with the change in real GDP less just services is a higher 57%, though over the last ten years it only has been 34%.
The new orders sub index ticked up m/m to 50.2 from 49.6 in
February.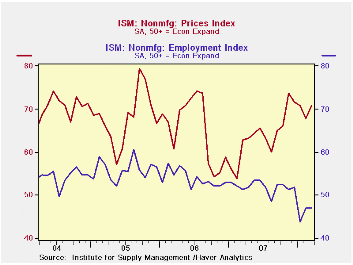
Conversely the employment sub-index remained unchanged m/m at 46.9, near its lowest level since late 2002. Since the series' inception in 1997 there has been a 56% correlation between the level of the ISM non-manufacturing employment index and the m/m change in payroll employment in the service producing plus the construction industries.
Pricing power increased as indicated by a rise in the prices paid index which recovered the February decline. Nevertheless, the index remained below the November '07 high. Since inception ten years ago, there has been a 60% correlation between the price index and the q/q change in the GDP services chain price index.
ISM surveys more than 370 purchasing managers in more than 62 industries including construction, law firms, hospitals, government and retailers. The non-manufacturing survey dates back to July 1997.
The Business Activity Index for the non-manufacturing sector reflects a question separate for the subgroups mentioned above. In contrast, the ISM manufacturing sector composite index is a weighted average of its five components.
Developments in Financial Markets is this morning's testimony by Fed Chairman Ben S. Bernanke and it is available here.
| ISM Nonmanufacturing Survey | March | February | March '07 | 2007 | 2006 | 2005 |
|---|---|---|---|---|---|---|
| Business Activity Index | 52.2 | 50.8 | 53.0 | 56.0 | 58.0 | 60.2 |
| Prices Index | 70.8 | 67.9 | 62.9 | 63.8 | 65.3 | 68.0 |
by Tom Moeller April 3, 2008
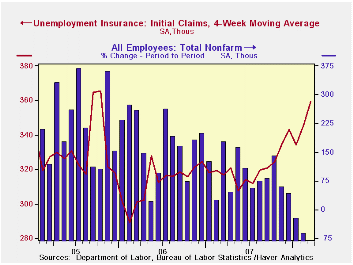
Initial unemployment insurance claims surged 38,000 last week to 407,000. A dip of 6,000 during the prior week was revised slightly from the 9,000 worker decline reported initially. The latest was near the highest level since September 2005. Consensus expectations had been for 365,000 initial claims last week.
The Labor Department indicated that the early Easter Holiday,
and the associated difficulty of seasonally adjusting the data, may
have boosted the figure. If so unemployment claims would fall sharply
this week. Also, a strike at the American Axel company may be
contributing to the rise in claims.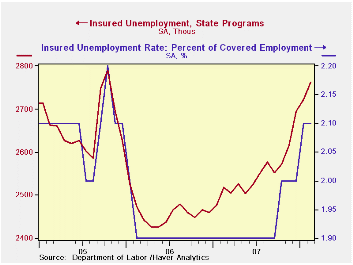
Last week's level was the highest since September 2005. At that time payroll employment, as reported by the Bureau of Labor Statistics, was still growing by at least 100,000 per month.
A claims level below 400,000 typically has been associated with growth in nonfarm payrolls. During the last ten years there has been a (negative) 76% correlation between the level of initial claims and the m/m change in nonfarm payroll employment.
The four week moving average of initial claims rose to 374,500 (20.1% y/y).
Continuing claims for unemployment insurance surged by 97,000 after a revised 25,000 worker decline during the prior week. Insured unemployment was at its highest level since mid 2004. The figure provides some indication of workers' ability to find employment.
The continuing claims numbers lag the initial claims figures by one week.
The insured rate of unemployment rose slightly to 2.2%.
| Unemployment Insurance (000s) | 03/28/08 | 03/21/08 | Y/Y | 2007 | 2006 | 2005 |
|---|---|---|---|---|---|---|
| Initial Claims | 407 | 369 | 27.6% | 322 | 313 | 331 |
| Continuing Claims | -- | 2,937 | 18.0% | 2,552 | 2,459 | 2,662 |
by Robert Brusca April 3, 2008
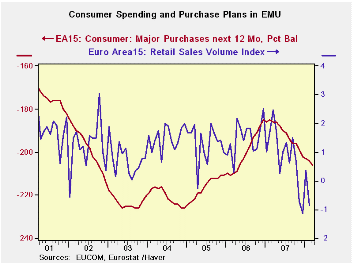
Retail sales are clearly damaged goods in the Euro Area. The drop in February sales was not expected. Two months into the new quarter retail sales volume growth is dead flat. Trend spending growth shows all negative numbers but the degree of decline is steadily diminishing. High and rising food prices are affecting the volume of sales for food. Outside of food, purchases are weak but are showing some resilience with an increase over the recent three months. Nonfood purchases are rising at a 1.8% annual rate in the current quarter. Both Germany and the UK are demonstrating some resilience in the recent three months.
| Euro Area 15 Retail Sales Volume | ||||||
|---|---|---|---|---|---|---|
| Feb-08 | Jan-08 | Dec-07 | 3-Mo | 6-Mo | 12-Mo | |
| Euro Area 15 Total | -0.5% | 0.5% | 0.0% | -0.3% | -2.1% | -0.9% |
| Food | -0.2% | 0.0% | -0.3% | -1.7% | -2.5% | -1.9% |
| Nonfood | -0.8% | 0.9% | 0.0% | 0.3% | -1.8% | -0.3% |
| Textiles | #N/A | 1.7% | 0.2% | 5.6% | -0.2% | 2.5% |
| HH Goods | #N/A | 0.7% | 0.6% | 1.9% | -2.0% | 0.5% |
| Books newspapers | #N/A | 1.2% | -0.4% | 3.8% | 0.5% | 2.4% |
| Pharmaceutical | #N/A | 0.3% | 0.1% | 1.8% | 2.5% | 3.2% |
| Other nonspecialized stores | #N/A | 0.8% | -0.1% | -0.1% | 0.3% | 1.7% |
| Mail order | #N/A | 0.2% | 3.0% | 7.6% | 2.1% | 4.4% |
| Nonfood Country Detail; Volume | ||||||
| Germany | -0.6% | 1.6% | -0.5% | 1.7% | -2.0% | -1.1% |
| France | #N/A | 0.6% | 1.0% | #N/A | #N/A | #N/A |
| Italy (Total: Value) | #N/A | 0.2% | 0.0% | -0.4% | 0.9% | 0.8% |
| UK (EU) | 1.8% | 1.0% | 0.2% | 12.8% | 8.8% | 8.3% |
| Shaded areas calculated on a one-month lag due to lagging data. | ||||||
| The EA 15 countries are Austria, Belgium, Cyprus, Finland, France, Germany, Greece, Ireland, Italy, Luxembourg, Malta, the Netherlands, Portugal, Slovenia and Spain. | ||||||
by Robert Brusca April 3, 2008
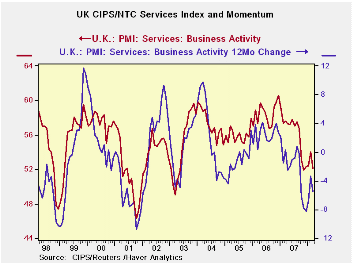
The UK service sector index for March is a fresh release and it shows a drop in the index to 52.11 from 54.05 in February. At that level the service sector index lies in the 33rd percentile of its range of values since 1995. The MFG sector lies at the 50th percentile, its range midpoint over a longer period going back to 1992. Construction, with an index available over the same period as for services ,is in the lower ten percentile of its range.
For business services the prices-charged index fell to 56.2 from 56.8 and shows less pressure than the MFG price indexes released earlier.
| MFG, Construction and Services PMI CIPS/NTC | |||||||
|---|---|---|---|---|---|---|---|
| Monthly Readings | Change Over: | Percentile | |||||
| Mar-08 | Feb-08 | Jan-08 | 3MO | 6MO | 12MO | of range | |
| MFG | 51.35 | 51.32 | 50.63 | -1.04 | -3.15 | -3.34 | 50.3 |
| Construction | 47.19 | 52.44 | 53.87 | -8.80 | -13.06 | -11.70 | 10.2 |
| Services | 52.11 | 54.05 | 52.46 | -0.25 | -4.58 | -5.47 | 33.8 |
| MFG range since January 1992; Construction Since April 1997 Services Since July 1995. | |||||||

Tom Moeller
AuthorMore in Author Profile »Prior to joining Haver Analytics in 2000, Mr. Moeller worked as the Economist at Chancellor Capital Management from 1985 to 1999. There, he developed comprehensive economic forecasts and interpreted economic data for equity and fixed income portfolio managers. Also at Chancellor, Mr. Moeller worked as an equity analyst and was responsible for researching and rating companies in the economically sensitive automobile and housing industries for investment in Chancellor’s equity portfolio. Prior to joining Chancellor, Mr. Moeller was an Economist at Citibank from 1979 to 1984. He also analyzed pricing behavior in the metals industry for the Council on Wage and Price Stability in Washington, D.C. In 1999, Mr. Moeller received the award for most accurate forecast from the Forecasters' Club of New York. From 1990 to 1992 he was President of the New York Association for Business Economists. Mr. Moeller earned an M.B.A. in Finance from Fordham University, where he graduated in 1987. He holds a Bachelor of Arts in Economics from George Washington University.
More Economy in Brief


