 Global| Nov 29 2018
U.S. Initial Claims for Unemployment Insurance Rise to Highest Level Since Mid-May
Summary
Initial claims for unemployment insurance increased to 234,000 (-2.1% y/y) during the week ended November 24 from an unrevised 224,000 in the previous week. This is the highest number of initial claims since mid-May, though claims [...]
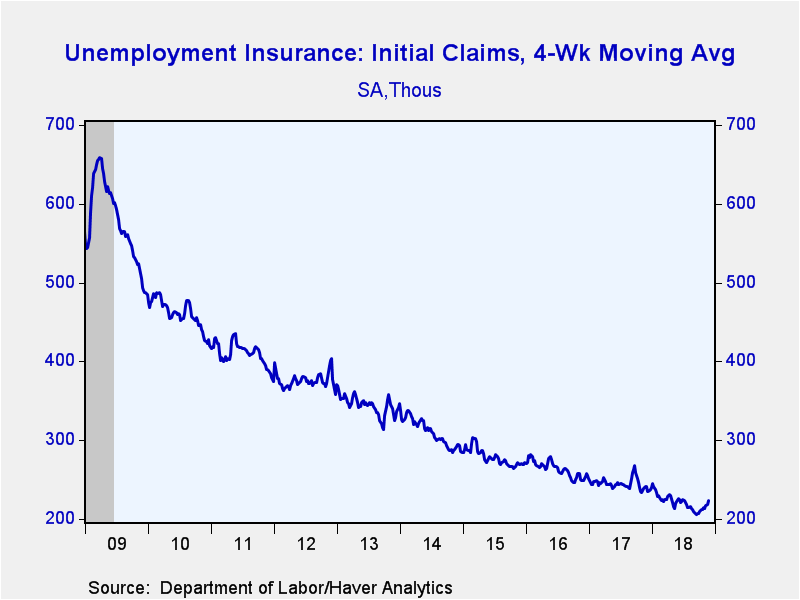
Initial claims for unemployment insurance increased to 234,000 (-2.1% y/y) during the week ended November 24 from an unrevised 224,000 in the previous week. This is the highest number of initial claims since mid-May, though claims still remain very low by historical standards. While the data is adjusted for seasonal factors, the Thanksgiving holiday may have affected this reading. The Action Economics Forecast Survey expected 217,000 claims. The four-week moving average of initial claims rose to 223,250, a four-month high.
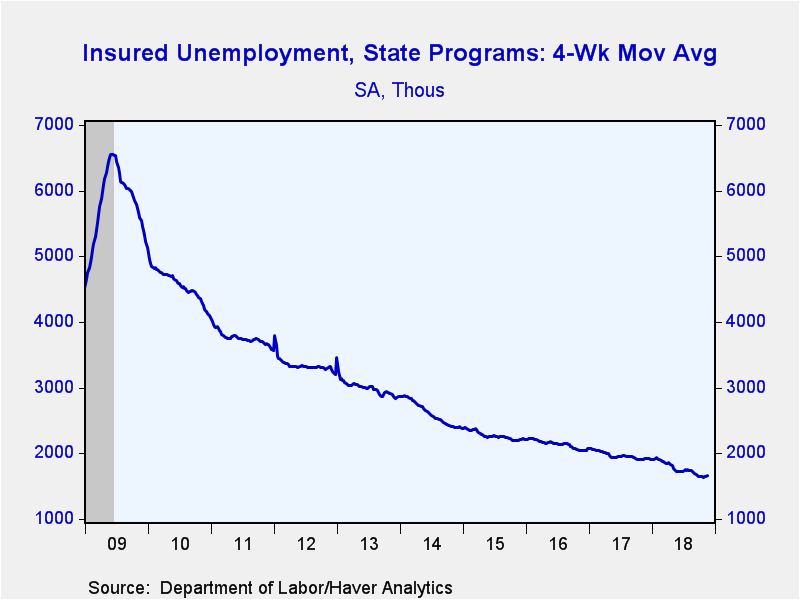
Continuing claims for unemployment insurance rose 50,000 to 1.710 million (-12.1% y/y) in the week ending November 17, from the slightly downwardly revised 1.660 million in the prior week. This is the highest reading since late August. The four-week moving average of claimants increased to 1,667,750.
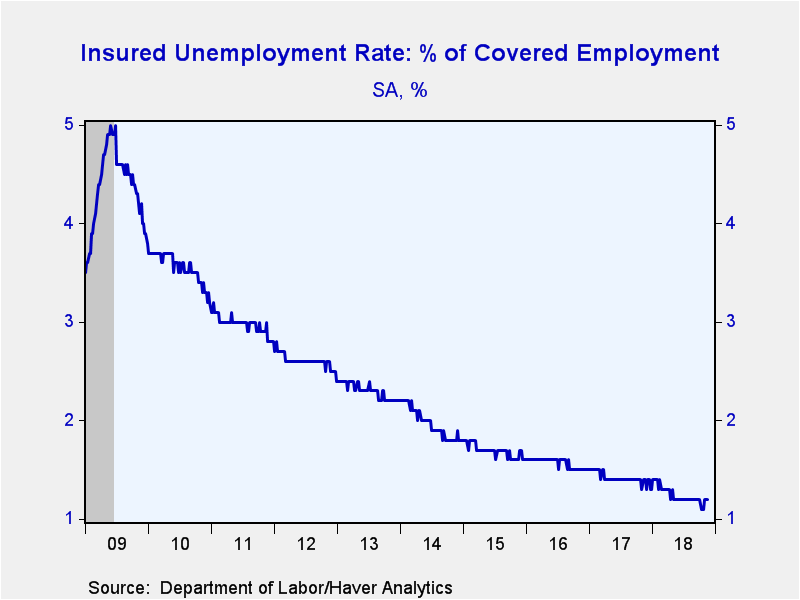
The insured rate of unemployment remained at 1.2%. It had declined to a record low 1.1% for a brief period in October. Data on the insured unemployment rate go back to 1971.
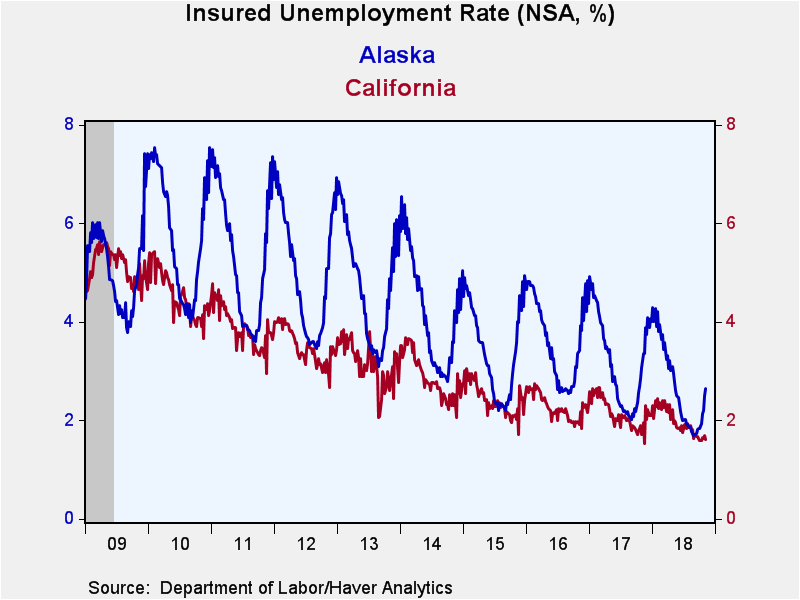
Insured rates of unemployment vary widely by state. During the week ending November 10, the lowest rates were in South Dakota (0.26%), Nebraska (0.34%), North Dakota (0.41%), North Carolina (0.42%) and Tennessee (0.47%). The highest rates were in Pennsylvania (1.46%), Connecticut (1.60%), California (1.61%), New Jersey (2.03%), and Alaska (2.64%). Among the other largest states by population, the rate was 0.86% in Texas, 0.49% in Florida and 1.26% in New York. These state data are not seasonally adjusted.
Data on weekly unemployment claims going back to 1967 are contained in Haver's WEEKLY database, and they are summarized monthly in USECON. Data for individual states are in REGIONW. The expectations figure is from the Action Economics Forecast Survey, carried in the AS1REPNA database.
| Unemployment Insurance (SA, 000s) | 11/24/18 | 11/17/18 | 11/10/18 | Y/Y % | 2017 | 2016 | 2015 |
|---|---|---|---|---|---|---|---|
| Initial Claims | 234 | 224 | 221 | -2.1 | 245 | 263 | 278 |
| Continuing Claims | -- | 1,710 | 1,660 | -12.1 | 1,961 | 2,136 | 2,267 |
| Insured Unemployment Rate (%) | -- | 1.2 | 1.2 |
1.4 |
1.4 | 1.6 | 1.7 |
Gerald D. Cohen
AuthorMore in Author Profile »Gerald Cohen provides strategic vision and leadership of the translational economic research and policy initiatives at the Kenan Institute of Private Enterprise.
He has worked in both the public and private sectors focusing on the intersection between financial markets and economic fundamentals. He was a Senior Economist at Haver Analytics from January 2019 to February 2021. During the Obama Administration Gerald was Deputy Assistant Secretary for Macroeconomic Analysis at the U.S. Department of Treasury where he helped formulate and evaluate the impact of policy proposals on the U.S. economy. Prior to Treasury, he co-managed a global macro fund at Ziff Brothers Investments.
Gerald holds a bachelor’s of science from the Massachusetts Institute of Technology and a Ph.D. in Economics from Harvard University and is a contributing author to 30-Second Money as well as a co-author of Political Cycles and the Macroeconomy.
More Economy in Brief
 Global| Feb 05 2026
Charts of the Week: Balanced Policy, Resilient Data and AI Narratives
by:Andrew Cates


