 Global| Sep 20 2012
U.S. Initial Claims for Jobless Insurance Trend Up but Slip W/W
by:Tom Moeller
|in:Economy in Brief
Summary
The four-week moving average of initial claims for unemployment insurance rose to 377,750 last week, its highest level since late-June. On a weekly basis,initial jobless insurance claims fell to 382,000 during the week ended September [...]
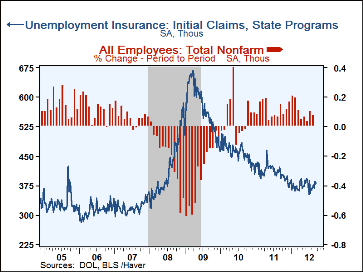
The four-week moving average of initial claims for unemployment insurance rose to 377,750 last week, its highest level since late-June. On a weekly basis,initial jobless insurance claims fell to 382,000 during the week ended September 15 versus a revised 385,000 during the prior week. Consensus expectations were for a decline to 370,000 during last week.
The latest claims figure covers the survey period for September nonfarm payrolls. Claims rose 8,000 (2.1%) from the August period. During the last ten years there has been a 75% correlation between the level of initial claims and the m/m change in payroll employment.
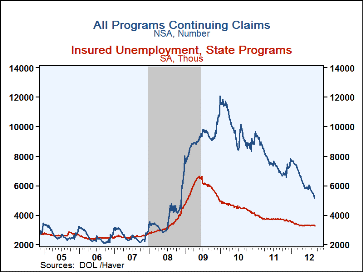
Continuing claims for unemployment insurance fell to 3.272M (-12.0% y/y) during the week of September 8. The insured rate of unemployment remained at 2.6% where it's been since March. This particular count covers only "regular" programs and does not include all extended benefit and other specialized jobless insurance programs. In the week of September 1, the latest figure available, the grand total of all benefit recipients again fell sharply to a recovery low of 5.174M. The latest was down -24.9% y/y and was off by more than one-half since the peak in January 2010.
By state the insured unemployment rate continued to vary greatly with Virginia (1.20%), Indiana (1.54%), Texas (1.59%), Ohio (1.58%), Louisiana (1.76%), Florida (1.90%), Georgia (1.93%) and Michigan (2.04%) at the low end of the range. At the high end were Illinois (2.58%), Massachusetts (2.70%), Nevada (2.93%), New York (3.00%), California (3.06%), Connecticut (3.26%), Pennsylvania (3.46%) and New Jersey (3.64%).
Data on weekly unemployment insurance programs are contained in Haver's WEEKLY database, including the seasonal factor series, and they are summarized monthly in USECON. Data for individual states, including the unemployment rates that determine individual state eligibility for the extended benefits programs and specific "tiers" of the emergency program, are in REGIONW, a database of weekly data for states and various regional divisions. Action Economics consensus survey estimates are in AS1REPNA.
| Unemployment Insurance (000s) | 09/15/12 | 09/08/12 | 09/01/12 | Y/Y% | 2011 | 2010 | 2009 |
|---|---|---|---|---|---|---|---|
| Initial Claims | 382 | 385 | 367 | -8.4 | 409 | 459 | 574 |
| Continuing Claims | -- | 3,272 | 3,304 | -12.0 | 3,745 | 4,544 | 5,807 |
| Insured Unemployment Rate (%) | -- | 2.6 | 2.6 | 3.0 (9/11) |
3.0 | 3.6 | 4.4 |
| Total "All Programs" (NSA) | -- | -- | 5.174M | -24.9 | 7.750M | 9.850M | 9.163M |
By Tom Moeller
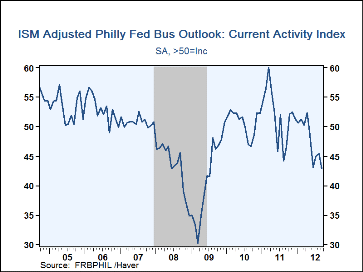
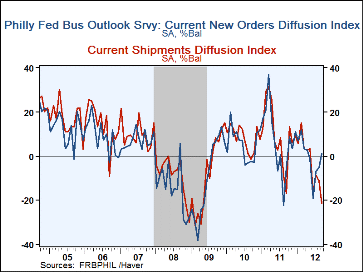
The Philadelphia Federal Reserve Bank reported that its General Business Conditions Index rose to -1.9 this month after gaining to an unrevised -7.1 during August. The improvement beat expectations for -4.0. That, however, is where the good news ends. Haver Analytics constructs a seasonally adjusted figure comparable to the ISM index. It fell to 42.9, it lowest level since July 2009, the first month of this economic recovery.
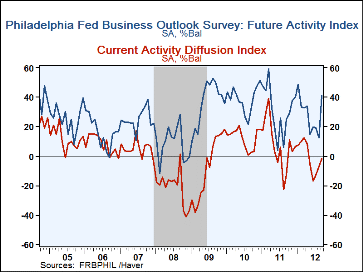
Monthly improvement amongst the component series centered on orders and delivery times. The employment figure also improved slightly to -7.3 but remained near its recovery low. During the last ten years there has been an 83% correlation between the employment index and the m/m change in factory sector payrolls. Offsetting these gains where sharp deteriorations in both the shipments and inventories components.
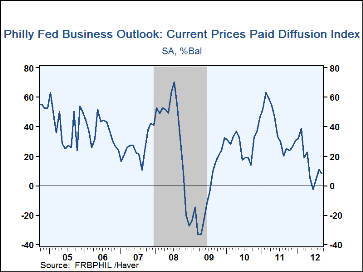
Pricing power also deteriorated m/m. The index decline to 8.0 retraced nearly half of its August improvement. During the last ten years there has been a 71% correlation between the prices paid index and three-month growth in the intermediate goods PPI.
The separate index of expected business conditions in six months improved sharply to 41.2, the highest level since March of last year. New orders, shipments, unfilled orders, delivery times, and employment each jumped.
The survey panel consists of 150 manufacturing companies in Federal Reserve District III (consisting of southeastern PA, southern NJ and Delaware.) The diffusion indexes represent the percentage of respondents indicating an increase minus the percentage indicating a decrease in activity. The figures from the Philadelphia Federal Reserve can be found in Haver's SURVEYS database. The Consensus expectations figure is available in AS1REPNA.
| Philadelphia Fed (%) | Sep | Aug | Jul | Sep'11 | 2011 | 2010 | 2009 |
|---|---|---|---|---|---|---|---|
| ISM-Adjusted General Business Conditions | 42.9 | 45.4 | 44.9 | 46.5 | 51.9 | 50.7 | 41.2 |
| General Business Conditions | -1.9 | -7.1 | -12.9 | -12.7 | 7.7 | 12.1 | -7.6 |
| New Orders | 1.0 | -5.5 | -6.9 | -5.5 | 7.1 | 5.5 | -9.5 |
| Shipments | -21.2 | -11.3 | -8.6 | -16.6 | 9.9 | 8.3 | -7.9 |
| Unfilled Orders | -8.2 | -16.2 | -9.5 | -8.7 | -0.9 | -3.0 | -15.2 |
| Delivery Time | -8.4 | -12.2 | -15.7 | -4.9 | -0.4 | 0.9 | -15.2 |
| Inventories | -21.7 | -6.9 | -7.5 | 8.7 | -0.4 | -5.0 | -24.0 |
| Number of Employees | -7.3 | -8.6 | -8.4 | 7.3 | 11.0 | 4.6 | -23.8 |
| Prices Paid | 8.0 | 11.2 | 3.7 | 25.0 | 38.6 | 28.8 | -3.6 |
U.S. Leading Indicators Slip
by Tom Moeller September 20, 2012
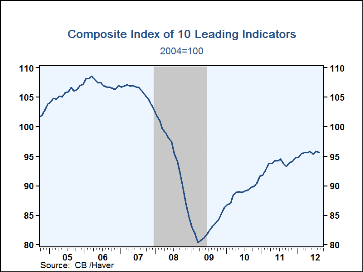
The Leading Economic Indicator index from the Conference Board matched expectations and edged 0.1% lower last month. That followed a revised 0.5% July gain, initially reported as 0.4%. Sixty percent of the component series had a negative influence on the index last month including a lower ISM new orders index, lower consumer expectations, a shorter work week, more initial unemployment insurance claims and fewer building permits. These declines were offset by a steeper interest rate yield spread, higher stock prices and more orders for non-defense capital goods less aircraft.
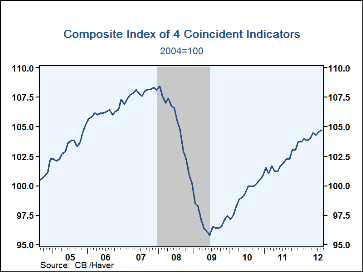
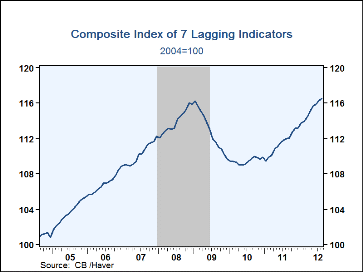
The index of coincident indicators ticked 0.1% higher following a 0.3% July gain. Gains in manufacturing and trade sales, payroll employment and real disposable income were offset by lower industrial output. The index of lagging indicators rose 0.2% following a lessened 0.3% July increase. A higher CPI for services and more C&I loans outstanding provided for the increase.
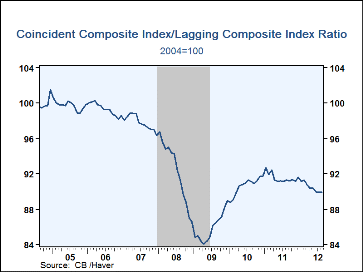
Another leading economic series is the ratio of coincident-to-lagging indicators. It measures how the economy is performing versus its excesses. The figure held steady last month but remained sharply below its high during January last year.
The Conference Board figures are available in Haver's BCI database; the components are available there, and most are also in USECON. The forecast figure for the Consensus are in the AS1REPNA database. Visit the Conference Board's site for coverage of leading indicator series from around the world.
| Business Cycle Indicators (%) | Aug | Jul | Jun | Y/Y | 2011 | 2010 | 2009 |
|---|---|---|---|---|---|---|---|
| Leading | -0.1 | 0.5 | -0.5 | 2.1 | 5.2 | 7.6 | -12.8 |
| Coincident | 0.1 | 0.3 | -0.2 | 2.4 | 2.8 | 2.5 | -7.7 |
| Lagging | 0.2 | 0.3 | 0.3 | 4.0 | 1.8 | -2.9 | -1.0 |

Tom Moeller
AuthorMore in Author Profile »Prior to joining Haver Analytics in 2000, Mr. Moeller worked as the Economist at Chancellor Capital Management from 1985 to 1999. There, he developed comprehensive economic forecasts and interpreted economic data for equity and fixed income portfolio managers. Also at Chancellor, Mr. Moeller worked as an equity analyst and was responsible for researching and rating companies in the economically sensitive automobile and housing industries for investment in Chancellor’s equity portfolio. Prior to joining Chancellor, Mr. Moeller was an Economist at Citibank from 1979 to 1984. He also analyzed pricing behavior in the metals industry for the Council on Wage and Price Stability in Washington, D.C. In 1999, Mr. Moeller received the award for most accurate forecast from the Forecasters' Club of New York. From 1990 to 1992 he was President of the New York Association for Business Economists. Mr. Moeller earned an M.B.A. in Finance from Fordham University, where he graduated in 1987. He holds a Bachelor of Arts in Economics from George Washington University.
More Economy in Brief


