 Global| Jan 12 2007
U.S. Import Prices Jumped
by:Tom Moeller
|in:Economy in Brief
Summary
Higher petroleum prices fueled a 1.1% jump in overall import prices last month which was about double Consensus expectations for a 0.6% gain. The increase occurred as petroleum import prices surged 4.8% in December after sharp [...]
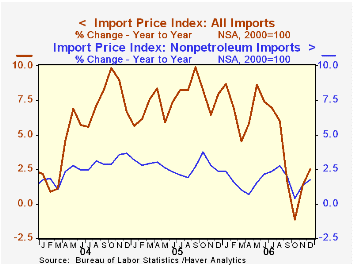
Higher petroleum prices fueled a 1.1% jump in overall import prices last month which was about double Consensus expectations for a 0.6% gain.
The increase occurred as petroleum import prices surged 4.8% in December after sharp declines during the prior three months. So far in January the price of WTI crude oil has fallen roughly six dollars (-10%) from the $62.03 per bbl. averaged in December and yesterday's price was down ten dollars to $51.89.
Less petroleum import prices rose 0.4% in December and the prior month's increase was revised up to 0.9% from 0.7%. During the last ten years there has been a 66% (negative) correlation between the nominal trade-weighted exchange value of the US dollar vs. major currencies and the y/y change in non oil import prices. The correlation is a lower 47% against a broader basket of currencies.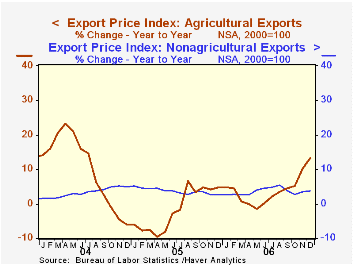
Prices for nonoil industrial supplies & materials surged 1.5% (4.5% y/y) after a 4.0% November spike. Prices for nondurable industrial supplies less petroleum rose 2.6% (-5.8% y/y) after an upwardly revised 8.9% November jump. Prices for durable industrial supplies & materials rose 0.7% (14.7% y/y).
Capital goods prices ticked up 0.1% (0.4% y/y) and excluding a 0.1% (-3.6% y/y) decline in computers, capital goods prices rose 0.2% (2.2% y/y) in December. Prices for nonauto consumer goods rose 0.2% (1.2% y/y).
Export prices rose 0.7% as agricultural export prices surged 2.2% (13.2% y/y) but nonagricultural export prices rose 0.5% (3.8% y/y).
The Adjustment of Global External Imbalances: Does Partial Exchange Rate Pass-through to Trade Prices Matter? from the Federal Reserve Board is available here.
The Internationalization of the Dollar and Trade Balance Adjustment from the Federal Reserve Bank of New York can be found here.
| Import/Export Prices (NSA) | December | November | Y/Y | 2006 | 2005 | 2004 |
|---|---|---|---|---|---|---|
| Import - All Commodities | 1.1% | 0.5% | 2.5% | 4.9% | 7.5% | 5.6% |
| Petroleum | 4.8% | -1.2% | 6.2% | 20.7% | 37.6% | 30.5% |
| Non-petroleum | 0.4% | 0.9% | 1.7% | 1.7% | 2.7% | 2.6% |
| Export- All Commodities | 0.7% | 0.4% | 4.6% | 3.6% | 3.2% | 3.9% |

Tom Moeller
AuthorMore in Author Profile »Prior to joining Haver Analytics in 2000, Mr. Moeller worked as the Economist at Chancellor Capital Management from 1985 to 1999. There, he developed comprehensive economic forecasts and interpreted economic data for equity and fixed income portfolio managers. Also at Chancellor, Mr. Moeller worked as an equity analyst and was responsible for researching and rating companies in the economically sensitive automobile and housing industries for investment in Chancellor’s equity portfolio. Prior to joining Chancellor, Mr. Moeller was an Economist at Citibank from 1979 to 1984. He also analyzed pricing behavior in the metals industry for the Council on Wage and Price Stability in Washington, D.C. In 1999, Mr. Moeller received the award for most accurate forecast from the Forecasters' Club of New York. From 1990 to 1992 he was President of the New York Association for Business Economists. Mr. Moeller earned an M.B.A. in Finance from Fordham University, where he graduated in 1987. He holds a Bachelor of Arts in Economics from George Washington University.
More Economy in Brief


