Global| Nov 09 2007
U.S. Import Price Inflation Heated Up
by:Tom Moeller
|in:Economy in Brief
Summary
U.S. import prices during October surged 1.8%, the largest one month gain since May of last year, as petroleum prices jumped. Consensus expectations had been for a 1.1% increase. Prices of petroleum products rose jumped 6.9% as Brent [...]
U.S. import prices during October surged 1.8%, the largest one month gain since May of last year, as petroleum prices jumped. Consensus expectations had been for a 1.1% increase.
Prices of petroleum products rose jumped 6.9% as Brent crude oil prices rose 7.4% to an average $82.70 per barrel.
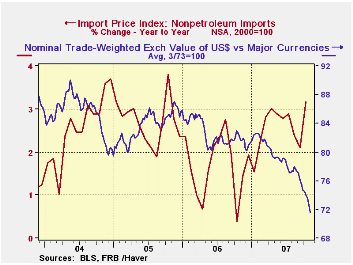
Less petroleum, the 0.5% gain in import prices was the largest one month gain since May and the y/y gain in prices of 3.2% was the fastest since the end of 2005.The lower dollar is having its effect in raising import prices. During the last ten years there has been a 66% (negative) correlation between the nominal trade-weighted exchange value of the US dollar vs. major currencies and the y/y change in non oil import prices. The correlation is a reduced 47% against a broader basket of currencies.
So far, the dollar's effect has been moderate but it has led to a turnaround in pricing pressure. Capital goods prices less the high tech sector rose 0.2% in October (2.9% y/y) but that y/y gain is an acceleration from the 1.4% rise during all of 2006. Consumer goods prices rose 0.1% for the third straight month, but again, the y/y rise of 1.4% is up from the 0.4% 2006 increase. Imported motor vehicle & parts prices rose 0.4% producing a y/y gain of 1.2%, double last year's gain.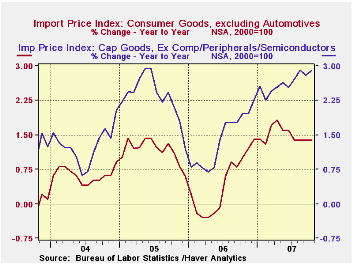
Why a Dollar Depreciation May Not Close the U.S. Trade Deficit from the Federal Reserve Bank of New York is available here.
Prices for industrial supplies & materials excluding petroleum surged 1.5% after three months of decline, lifting the y/y change to 8.9% and continuing the strength of the last several years. The detailed import price series can be found in the Haver USINT database.
Overall export prices increased 0.9%. Prices for agricultural products jumped another 3.9% (26.8% y/y) and nonagricultural export prices rose 0.5% (3.9% y/y), roughly equal to the annual gains during the last three years.
A Falling Dollar: Good News or Bad News? from the Federal Reserve Bank of Atlanta can be found here.
| Import/Export Prices (NSA) | October | September | Y/Y | 2006 | 2005 | 2004 |
|---|---|---|---|---|---|---|
| Import - All Commodities | 1.8% | 0.8% | 9.6% | 4.9% | 7.5% | 5.6% |
| Petroleum | 6.9% | 4.6% | 41.4% | 20.6% | 37.6% | 30.5% |
| Non-petroleum | 0.5% | -0.2% | 3.2% | 1.7% | 2.7% | 2.6% |
| Export- All Commodities | 0.9% | 0.3% | 5.6% | 3.6% | 3.2% | 3.9% |

Tom Moeller
AuthorMore in Author Profile »Prior to joining Haver Analytics in 2000, Mr. Moeller worked as the Economist at Chancellor Capital Management from 1985 to 1999. There, he developed comprehensive economic forecasts and interpreted economic data for equity and fixed income portfolio managers. Also at Chancellor, Mr. Moeller worked as an equity analyst and was responsible for researching and rating companies in the economically sensitive automobile and housing industries for investment in Chancellor’s equity portfolio. Prior to joining Chancellor, Mr. Moeller was an Economist at Citibank from 1979 to 1984. He also analyzed pricing behavior in the metals industry for the Council on Wage and Price Stability in Washington, D.C. In 1999, Mr. Moeller received the award for most accurate forecast from the Forecasters' Club of New York. From 1990 to 1992 he was President of the New York Association for Business Economists. Mr. Moeller earned an M.B.A. in Finance from Fordham University, where he graduated in 1987. He holds a Bachelor of Arts in Economics from George Washington University.
More Economy in Brief