 Global| Oct 28 2020
U.S. Goods Trade Deficit Narrows in September from Record Gap
Summary
• Trade deficit decreased to $79.4 billion in September from a record $83.1 billion. • Exports grew by 2.7% while imports declined 0.2%. • Exports still 11.4% below February 2020 level. Imports up 2.4%. The advance estimate of the [...]
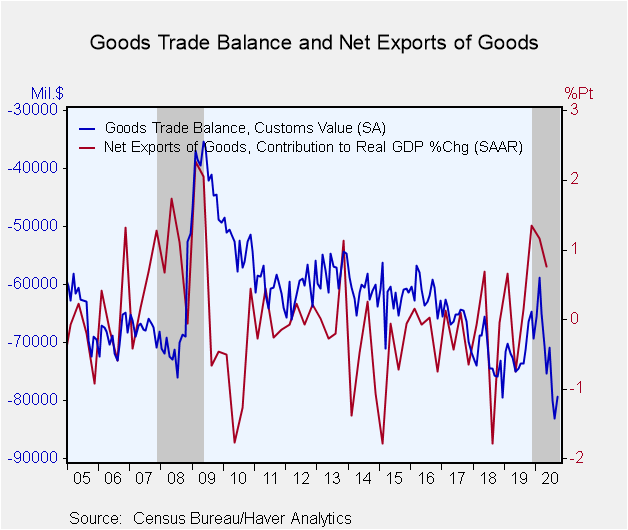
• Trade deficit decreased to $79.4 billion in September from a record $83.1 billion.
• Exports grew by 2.7% while imports declined 0.2%.
• Exports still 11.4% below February 2020 level. Imports up 2.4%.
The advance estimate of the U.S. trade deficit in goods unexpectedly narrowed to $79.37 billion in September from a record $83.11 in August (the August figures as well as the month-on-month and year-on-year comparisons below are based on revised data from the monthly International Trade Report; updated September figures will be released next week). The Action Economics Forecast Survey anticipated an $85.4 billion deficit.
Exports grew 2.7% on the month (-9.9% year-on-year) while imports edged down 0.2% (-2.5% y/y). Despite the growth gap, the trade deficit didn't narrow more because imports are roughly 70% larger than exports. This leaves exports 11.4% below their February level and 14.5% from the May 2018 peak. Meanwhile, imports are up 2.4% from February, but 7.3% below their October 2018 peak.
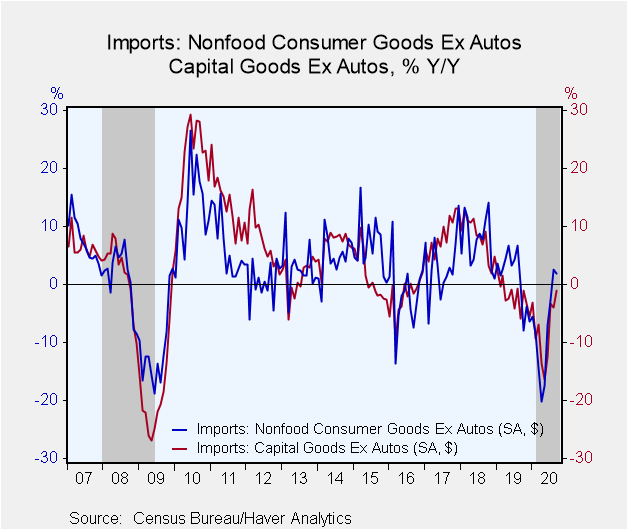
Five out of the six major categories of exports -- which is the only data available in the Advance Trade report -- grew. Exports of industrial supplies, which vies with capital goods to be our largest export category declined 0.8% (-11.4% y/y). Capital goods were up 3.6% (-16.3% y/y), The trend in import categories were split down the middle. Imports of nonfood consumer goods, fell 4.0% (+2.0% y/y) while capital goods, the second largest import category and an indicator of capital spending, grew 1.4% (-1.0% y/y).
The advance international trade data can be found in Haver's USECON database. The expectation figure is from the Action Economics Forecast Survey, which is in AS1REPNA.
| Advance U.S. Foreign Trade in Goods (Customs Value $) | Sep | Aug | Jul | Sep Y/Y | 2019 | 2018 | 2017 |
|---|---|---|---|---|---|---|---|
| U.S. Trade Deficit ($ bil.) | -79.37 | -83.11 | -80.01 | -71.14 (9/19) |
-854.37 | -872.04 | -792.40 |
| Exports (% Chg) | 2.7 | 3.0 | 12.1 | -9.9 | -1.4 | 7.7 | 6.6 |
| Imports (% Chg) | -0.2 | 3.3 | 12.4 | -2.5 | -1.6 | 8.5 | 7.0 |
Note: Current month is based on Advance Trade data; Previous months reflect revised data from International Trade release.
Gerald D. Cohen
AuthorMore in Author Profile »Gerald Cohen provides strategic vision and leadership of the translational economic research and policy initiatives at the Kenan Institute of Private Enterprise.
He has worked in both the public and private sectors focusing on the intersection between financial markets and economic fundamentals. He was a Senior Economist at Haver Analytics from January 2019 to February 2021. During the Obama Administration Gerald was Deputy Assistant Secretary for Macroeconomic Analysis at the U.S. Department of Treasury where he helped formulate and evaluate the impact of policy proposals on the U.S. economy. Prior to Treasury, he co-managed a global macro fund at Ziff Brothers Investments.
Gerald holds a bachelor’s of science from the Massachusetts Institute of Technology and a Ph.D. in Economics from Harvard University and is a contributing author to 30-Second Money as well as a co-author of Political Cycles and the Macroeconomy.
More Economy in Brief
 Global| Feb 05 2026
Charts of the Week: Balanced Policy, Resilient Data and AI Narratives
by:Andrew Cates


