 Global| Feb 03 2009
U.S. Gasoline Prices Up Again
by:Tom Moeller
|in:Economy in Brief
Summary
Despite the U.S. recession and reduced demand, regular gasoline prices again moved higher last week to an average $1.89 per gallon prices. That was up from 10 cents from the January average and up 28 cents from the December low, [...]
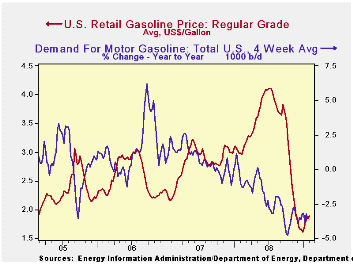
Despite the U.S. recession and reduced demand, regular gasoline prices again moved higher last week to an average $1.89 per gallon prices. That was up from 10 cents from the January average and up 28 cents from the December low, according to the U.S. Department of Energy survey. Yesterday, the spot market price for regular gasoline fell sharply backward from Friday's level to $1.17 per gallon (where it began the month of January). Spot prices still were up, however, by 32 cents from their December low.
Weekly gasoline prices can be found in Haver's WEEKLY
database. Daily prices are in the DAILY
database.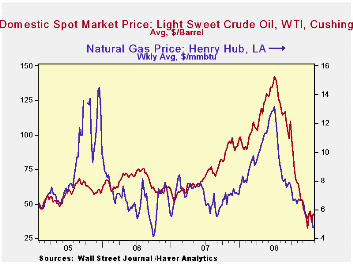
Demand continued quite weak for gasoline in reaction to the economy's weakness. The U.S. Department of Energy reported that the demand for gasoline fell by 3.5% during the latest four weeks. While the rate of decline remained nearly the fastest since late-1995 (the latest four weeks versus the same four weeks in 2008) it has been stable since November. The demand for all petroleum products also is down a sharp 4.0% y/y. These numbers are available in Haver's OILWKLY database.
The source for that reduced demand for gasoline is the cutback in vehicle miles driven which have fallen 5.3% year-to-year during the twelve months ended November. The rate of decline has been accelerating since late 2007 and it is nearly unprecedented. These Department of Transportation figures are available in Haver's OGJ database.
The price for a barrel of West Texas Intermediate crude moved slightly higher last week to $42.52 per barrel and it was up 10 dollars from the low reached late in December. Prices reached a high of $145.66 last July. In futures trading yesterday, the one-month price for crude oil fell versus last week to $40.08 per barrel, down sharply from one week ago.
The price of natural gas fell again, last week to $4.75 per mmbtu (-40.9% y/y). The latest average price was down roughly two-thirds from the high reached in early-July of $13.19/mmbtu.
Labor Supply Responses to Changes in Wealth and Credit from the Federal Reserve Bank of San Francisco is available here.
| Weekly Prices | 02/02/09 | 01/25/09 | Y/Y | 2008 | 2007 | 2006 |
|---|---|---|---|---|---|---|
| Retail Regular Gasoline ($ per Gallon) | 1.89 | 1.84 | -36.5% | 3.25 | 2.80 | 2.57 |
| Light Sweet Crude Oil, WTI ($ per bbl.) | 42.52 | 42.18 | -53.3% | 100.16 | 72.25 | 66.12 |
U.S. Chain Store Sales Recovered Last Week
by Tom Moeller February 3, 2009
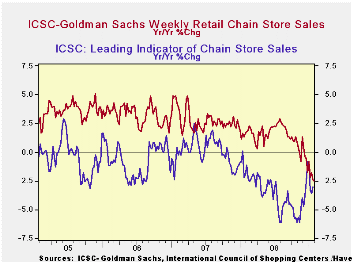
With a 1.6% increase last week chain store sales recovered nearly all of the prior week's decline, according to the International Council of Shopping Centers-Goldman Sachs Index. Nevertheless, the year-to year change of -2.5% continued as the weakest in the series' history which extends back to 1990. For January as a whole, sales ticked up 0.1% from December after that month's 0.3% gain.
During the last ten years there has been a 64% correlation between the year-to-year growth in chain store sales and the growth in general merchandise sales.
The ICSC-Goldman Sachs retail chain-store sales index is constructed using the same-store sales (stores open for one year) reported by 78 stores of seven retailers: Dayton Hudson, Federated, Kmart, May, J.C. Penney, Sears and Wal-Mart.
The outlook for sales weakened further as the weekly leading indicator of chain store sales from ICSC-Goldman Sachs fell 0.7% and it was the third straight week of decline. The average level in January was up 0.6% from December, which rose 2.1% versus November. Since the lows of one month ago the index has recovered 3.0%.
The chain store sales figures are available in Haver's SURVEYW database.
The January 2009 Senior Loan Officer Opinion Survey on Bank Lending Practices from the Federal Reserve Board can be found here.
| ICSC-UBS (SA, 1977=100) | 01/30/09 | 01/23/09 | Y/Y | 2008 | 2007 | 2006 |
|---|---|---|---|---|---|---|
| Total Weekly Chain Store Sales | 478.5 | 471.0 | -2.5% | 1.4% | 2.8% | 3.3% |
German Retail Sales Head South For The Winter
by Robert Brusca February 3, 2009
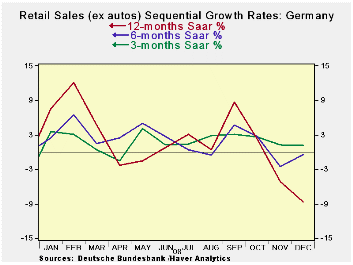
German nominal and real ex-auto retail sales are off for the
third month in a row. In the fourth quarter nominal retail sales are
off at a 4% pace; ex-auto real retail sales are dropping at a 2.1%
pace. The sequential growth rates show an accelerating pattern of
losses from 12-months to 6-months to 3-months, across the main
categories in the table.
The downturn has spreading across other measures as well, as
manufacturing has been notoriously weak. German consumers have not been
much of a prop to this economy for a long time. In the quarter ended
Sept 2008 they did rise by 1.9% Q/Q (saar), but that was after falling
by 3.2% (saar) in the previous quarter. Yr/Yr quarterly average real
(ex auto) retail sales have been negative in German since the quarter
ended December 2006. Ironically the 2008-Q4 retail sales figures on
this same basis are up by 0.1%, the first quarterly increase since
Q4-2008 and it comes as sales have turned tail to move sharply lower in
the quarter.
The German retailing association HDE is looking for retail
sales to decline in real terms in 2009. Manufacturing is coming apart
at the seams. Construction is weak, The German economy, Europe’s
largest, is under fire.
| German Real and Nominal Retail Sales | QTR | |||||||
|---|---|---|---|---|---|---|---|---|
| Nominal | Dec-08 | Nov-08 | Oct-08 | 3-MO | 6-MO | 12-MO | YrAgo | Saar |
| Retaill Ex auto | -0.6% | -0.8% | -0.9% | -8.7% | -0.4% | 1.2% | -4.6% | -4.0% |
| Food Bev & Tobacco | -1.5% | -1.6% | 0.0% | -11.6% | -1.1% | 1.2% | -3.2% | -2.6% |
| Clothing footwear | -0.9% | 1.1% | -4.4% | -15.9% | 4.3% | 1.1% | -2.7% | -5. |
| Real | ||||||||
| Retail Ex auto | -0.2% | -0.1% | -0.9% | -4.6% | 0.6% | 0.2% | -6.5% | -2.1% |
U.S. Pending Home Sales Up in December But Down For 2008. Affordability At New High With Lower Rates & Prices
by Tom Moeller February 3, 2009
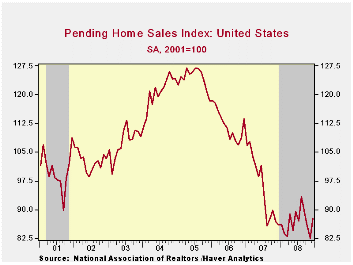
The National Association of Realtors indicated that pending sales of existing homes in December rose 6.3% The increase reversed most of the declines during the prior two months. Consensus expectations were for no change in sales m/m. For the year as a whole, sales fell 9.3% after declines of 14.6% and 9.8% during the prior two years. Despite the monthly sales increase, the December level was near the series' low.
The home sales figures are analogous to the new home sales
data from the Commerce Department in that they measure existing home
sales when the sales contract is signed, not at the time the sale is
closed. The series dates back to 2001.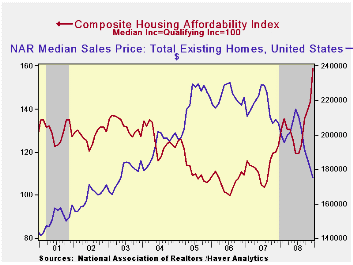
Lower prices continued to bolster home sales. The median sales price of an existing home in December fell for the sixth straight month and was down 15.3% year-to-year. Prices were down 23.4% from their peak during June of last year. For single-family homes only, prices fell 2.9% during December and they were off 23.8% from their peak. Lower prices combined with lower interest rates significantly raised the affordability index of a home. It reached a record high for the series which extends back to 1970.
A 13.0% December rise in the South led the latest increase in total sales but were still off 16.2% for the year. Sales in the Midwest also posted a 12.8% gain in December but that was not enough to keep full-year sales from falling 9.7%. December sales in the West fell 3.7% in December but rose 7.8% for the full year. Home sales in the Northeast ticked lower by 1.7% for the month but repeated their decline of 2007 and fell 15.2%.
Weak home sales are encouraging potential sellers to keep their homes off the market. The Realtors Association indicated in an earlier report that the number of homes on the market and available for sale fell by 11.7% last month, down 7.5% for the full year.
At the current sales rate there was a 9.3 months' supply of homes on the market and there was a 10.4 months' supply during all of last year, up from the 8.9 months supply during 2007 and 6.5 months during 2006. For single family homes, there was an 8.7 months' supply in December versus a full-year figure of 10.0 months.
The pending home sales data are available in Haver's PREALTOR database. The number of homes on the market and prices are in the REALTOR database.
The American Recovery and Reinvestment Act of 2009 from the Congressional Budget Office can be found here.
The Term Structure of Inflation Expectations from the Federal Reserve Bank of New York is available here.
| Pending Home Sales (2001=100) | December | November | Y/Y | 2008 | 2007 | 2006 |
|---|---|---|---|---|---|---|
| Total | 87.7 | 82.5 | 2.1% | 86.8 | 95.7 | 112.1 |
| Northeast | 62.1 | 63.2 | -14.5 | 72.6 | 85.6 | 98.5 |
| Midwest | 83.7 | 74.2 | -1.2 | 80.9 | 89.6 | 102.0 |
| South | 96.8 | 85.7 | 1.6 | 89.8 | 107.3 | 127.3 |
| West | 97.5 | 101.2 | 17.5 | 99.3 | 92.1 | 109.5 |

Tom Moeller
AuthorMore in Author Profile »Prior to joining Haver Analytics in 2000, Mr. Moeller worked as the Economist at Chancellor Capital Management from 1985 to 1999. There, he developed comprehensive economic forecasts and interpreted economic data for equity and fixed income portfolio managers. Also at Chancellor, Mr. Moeller worked as an equity analyst and was responsible for researching and rating companies in the economically sensitive automobile and housing industries for investment in Chancellor’s equity portfolio. Prior to joining Chancellor, Mr. Moeller was an Economist at Citibank from 1979 to 1984. He also analyzed pricing behavior in the metals industry for the Council on Wage and Price Stability in Washington, D.C. In 1999, Mr. Moeller received the award for most accurate forecast from the Forecasters' Club of New York. From 1990 to 1992 he was President of the New York Association for Business Economists. Mr. Moeller earned an M.B.A. in Finance from Fordham University, where he graduated in 1987. He holds a Bachelor of Arts in Economics from George Washington University.
More Economy in Brief


