 Global| Jul 22 2008
U.S. Gasoline Price Fell a Nickel, Crude Down $5.00
by:Tom Moeller
|in:Economy in Brief
Summary
The retail price for a gallon of regular gasoline dropped five cents last week to $4.06 per gallon, according to the U.S. Department of Energy survey. For all grades of gasoline the average price also fell five cents to $4.12 per [...]
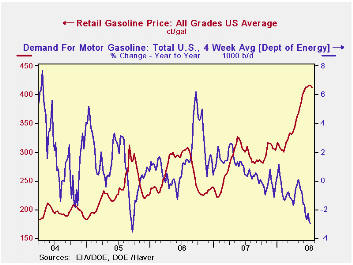
The retail price for a gallon of regular gasoline dropped five cents last week to $4.06 per gallon, according to the U.S. Department of Energy survey. For all grades of gasoline the average price also fell five cents to $4.12 per gallon.
Yesterday, the spot market price for a gallon of regular gasoline did rise a nickel versus Friday to $3.08 per gallon. The latest price was, however, down sharply from the highs one week ago above $3.40.
Weekly gasoline prices can be found in Haver's WEEKLY
database, daily prices are in the DAILY
database.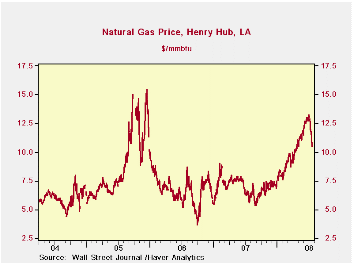
According to the U.S. Department of Energy the demand for gasoline during the latest four weeks fell 2.9% from a year earlier due to the increase in gasoline prices, along with the slowdown in economic growth. Gasoline demand was on the same negative pace as the prior week and it was the weakest reading for gasoline demand in three years.
The DOE figures are available in Haver's OILWKLY database.
The price for a barrel of West Texas Intermediate crude oil fell last week to an average $135.34 per barrel down from $142.46 at the beginning of the month. Yesterday, the price for a barrel of crude was $131.04.
Price for natural gas slipped for a second week. Last week's price averaged $11.26 per mmbtu (76.9% y/y) and prices fell further yesterday to $10.53.
| Weekly Prices | 07/21/08 | 07/14/08 | Y/Y | 2007 | 2006 | 2005 |
|---|---|---|---|---|---|---|
| Retail Regular Gasoline ($ per Gallon) | 4.06 | 4.11 | 37.4% | 2.80 | 2.57 | 2.27 |
| Light Sweet Crude Oil, WTI ($ per bbl.) | 135.34 | 140.16 | 80.6% | 72.25 | 66.12 | 56.60 |
by Tom Moeller July 22, 2008
 p
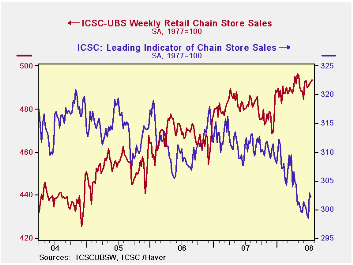
pChain store sales, as reported by the International Council of
Shopping Centers, ticked a modest 0.1% last week. The uptick followed
like moves during each of the prior three weeks and the level of sales
in July is up modestly from both the June and the May averages.p
p
pChain store sales, as reported by the International Council of
Shopping Centers, ticked a modest 0.1% last week. The uptick followed
like moves during each of the prior three weeks and the level of sales
in July is up modestly from both the June and the May averages.p
During the last ten years there has been a 45% correlation between the y/y change in chain store sales and the change in nonauto retail sales less gasoline.p
The ICSC-UBS retail chain-store sales index is constructed using the same-store sales (stores open for one year) reported by 78 stores of seven retailers: Dayton Hudson, Federated, Kmart, May, J.C. Penney, Sears and Wal-Mart.
During the latest week, the leading indicator of chain store sales from ICSC-UBS fell 0.2% (-2.5% y/y) after a 1.5% pop during the week prior.
The chain store sales figures are available in Haver's SURVEYW database.
| ICSC-UBS (SA, 1977=100) | 07/19/08 | 07/12/08 | Y/Y | 2007 | 2006 | 2005 |
|---|---|---|---|---|---|---|
| Total Weekly Chain Store Sales | 493.4 | 492.7 | 2.5% | 2.8% | 3.3% | 3.6% |
by Tom Moeller July 22, 2008
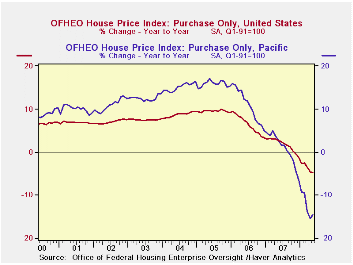
The index of U.S. house prices from the Office of Federal Housing Enterprise Oversight (OFHEO) fell 0.3% during May and prices were down 4.8% from a year earlier.
During the latest twelve months OFHEO indicated that the decline in home prices was by far the greatest in the Pacific region where prices fell 14.5% y/y. That followed a 1.0% rise in prices last year and several years of double digit gain.
Elsewhere in the country home prices fell one to five percent y/y except in the West South Central region where they rose slightly. Prices in New England and in the Mountain regions fell 5.0%.
The latest report from OFHEO can be found here.
OFHEO figures are available in Haver's USECON database.
House Prices and the Stance of Monetary Policy from the Federal Reserve Bank of St. Louis can be found here.
| OFHEO House Price Index (Q1 1991=100, SA) | May | April | Y/Y | 2007 | 2006 | 2005 |
|---|---|---|---|---|---|---|
| Purchase Only | 214.2 | 214.9 | -4.8% | 1.7% | 6.3% | 9.5% |
by Louise Curley July 22, 2008
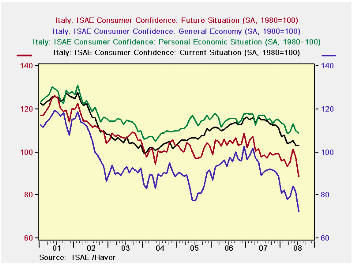
The Institute of Studies and Economic Analysis's (ISAE) index
of Italian consumer confidence fell 4.1% from June to 95.8 (1980=100)
in July, the lowest value since May 2004. Consumers' biggest concern
appears to be the general economy, the index for which declined 11.5%
in July, next in line is concern over future prospects, the index for
which declined 9.4%. The indexes for current conditions and personal
economic situation were down 0.1% and 0.9% respectively. These major
components of the consumer confidence index are shown in the first
chart.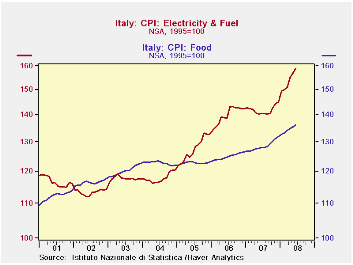
Although the decline in confidence was not unexpected, its magnitude was greater than the consensus expected. Among the reasons advanced for the deterioration in confidence are the increases in food and oil prices. The second chart plots the food and the electricity and fuel components of the Consumer Price Index. They are plotted on a log scale where percentage changes can be compared. The recent acceleration in the prices of both food and electricity and fuel is evident. Earlier this month the declines in purchasing power caused by rising food and fuel costs led to public demonstrations.
| ITALY | Jul 08 | Jun 08 | Jul 07 | M/M % chg | Y/Y % chg | 2007 | 2006 | 2005 |
|---|---|---|---|---|---|---|---|---|
| Consumer Confidence (1980=100) | 95.8 | 99.9 | 107.6 | -4.10 | 10.97 | 108.5 | 108.7 | 104.2 |
| Current Situation | 103.0 | 103.1 | 115.1 | -01. | -10.51 | 114.3 | 112.2 | 106.9 |
| Future Conditions | 88.4 | 97.6 | 98.7 | -9.43 | -10.44 | 100.6 | 104.4 | 101.1 |
| General Economic Situation | 72.2 | 81.6 | 91.2 | -11.52 | -20.83 | 93.8 | 95.6 | 85.5 |
| Personal Economic Situation | 108.9 | 109.9 | 112.0 | -.91 | -6.92 | 115.9 | 115.3 | 113.7 |
| Jun 08 | May 08 | Jun 07 | M/M % chg | Y/Y % chg | 2007 | 2006 | 2005 | |
| Consumer Price Index (1995=100) | 137.1 | 136.5 | 132.1 | 0.44 | 3.79 | 132.2 | 129.8 | 127.1 |
| Food | 136.2 | 135.6 | 129.0 | 0.44 | 6.41 | 128.6 | 125.0 | 122.8 |
| Electricity & Fuel | 158.8 | 156.9 | 140.7 | 1.21 | 12.86 | 141.9 | 140.0 | 127.6 |
by Robert Brusca July 22, 2008
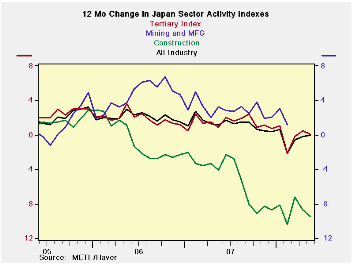
Japan’s sector indices show that the main all-industry reading
is up in May and stands strongly in the 95th percentile of its range.
The construction index is off sharply and continues to be very weak.
The table plots 12-month changes in the index while the table plots the
index levels. Index levels show construction is still very weak but the
tertiary and over all index are still strong. In terms of momentum all
indices are losing it. On balance the sector indices seem to be holding
up better than other gauges for the Japanese economy.
| Up to date Japan Industry Surveys | |||||||||
|---|---|---|---|---|---|---|---|---|---|
| Recent Months | Moving Averages | Extremes: Range | |||||||
| May 2008 |
Apr 2008 |
Mar 2008 |
3Mo | 6Mo | 12Mo | Max | Min | %-Tile | |
| All Industry | 107.5 | 107.1 | 106.2 | 106.9 | 106.9 | 107.3 | 108.1 | 93.8 | 95.8% |
| Construction | 70.6 | 71.8 | 72.5 | 71.6 | 71.8 | 73.4 | 124.6 | 70.6 | 0.0% |
| Tertiary | 110.4 | 110.6 | 108.5 | 109.8 | 109.7 | 110.1 | 110.9 | 92.0 | 97.4% |
| Ranges, Max, Min since 1993 | |||||||||

Tom Moeller
AuthorMore in Author Profile »Prior to joining Haver Analytics in 2000, Mr. Moeller worked as the Economist at Chancellor Capital Management from 1985 to 1999. There, he developed comprehensive economic forecasts and interpreted economic data for equity and fixed income portfolio managers. Also at Chancellor, Mr. Moeller worked as an equity analyst and was responsible for researching and rating companies in the economically sensitive automobile and housing industries for investment in Chancellor’s equity portfolio. Prior to joining Chancellor, Mr. Moeller was an Economist at Citibank from 1979 to 1984. He also analyzed pricing behavior in the metals industry for the Council on Wage and Price Stability in Washington, D.C. In 1999, Mr. Moeller received the award for most accurate forecast from the Forecasters' Club of New York. From 1990 to 1992 he was President of the New York Association for Business Economists. Mr. Moeller earned an M.B.A. in Finance from Fordham University, where he graduated in 1987. He holds a Bachelor of Arts in Economics from George Washington University.
More Economy in Brief


