 Global| Dec 22 2016
U.S. FHFA House Price Index Increase Eases Slightly
Summary
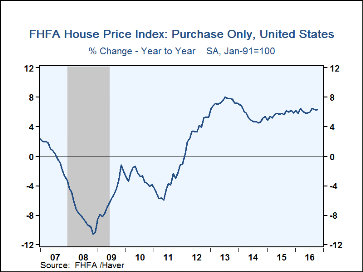
The Federal Housing Finance Agency's (FHFA) index of U.S. house prices rose 0.4% in October after an unrevised 0.6% gain in September. The y/y change remained fairly steady at 6.2%, as the three-month annualized growth in prices ran [...]
The Federal Housing Finance Agency's (FHFA) index of U.S. house prices rose 0.4% in October after an unrevised 0.6% gain in September. The y/y change remained fairly steady at 6.2%, as the three-month annualized growth in prices ran at a 7.2% rate, down a bit from September's firm 7.7%.
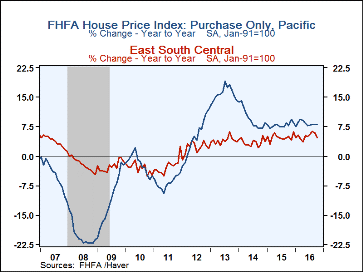
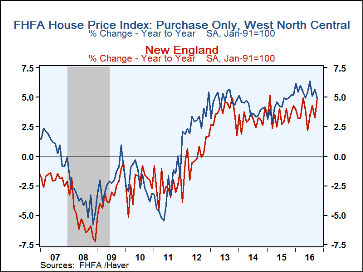
Seasonally adjusted house prices rose in each region of the country in October, except the East South Central and West North Central. See the table below for the listing of the states in each region. In the East South Central area, prices declined 0.6% after 0.1% in September, lowering the y/y change to 4.7% from 5.7% in September. In the West North Central region, they edged down 0.2% in October, following a positive 0.6% the month before; the year-on-year pace was 4.9% compared with 5.5% the month before.
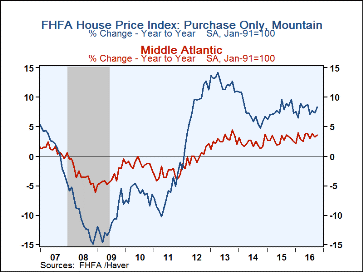
Prices were up but sluggish in the West South Central area, where they edged 0.1% higher, following September's firm 0.9%; year-to-year growth was 5.9%, off from 6.6% in September. The behavior in the Pacific region was similar: October's move was just 0.2%, after September's 1.3%, although the y/y change was hardly different, 8.0% versus 8.1%. There was a moderate gain in the Middle Atlantic region, 0.3%, a bit firmer than September's 0.1%, with the 12-month move up 3.6% after September's 3.5%.
Prices were strongest in the Mountain states, up 1.2% in October, following 0.6% the month before; the year-on-year change was 8.3%, also the strongest for that measure and up from 7.5% the month before. New England was next, with a 0.9% October advance, noticeably firmer than 0.3% in September; this lifted the y/y growth to 5.0% from 3.0%. In the South Atlantic area, the October rise was 0.7%, modest slower than September's 0.9%; the year-on-year change edged higher, though, to 7.6% from 7.3%. Finally, prices gained 0.6% in the East North Central region, up from 0.2% the prior month; the y/y moved improved slightly to 5.6% from 5.1%.
The FHFA house price index is a weighted repeat sales index, measuring average price changes in repeat sales of the same property. An associated quarterly index also includes refinancings on the same kinds of properties. The indexes are based on transactions involving conforming, conventional mortgages purchased or securitized by Fannie Mae or Freddie Mac. Only mortgage transactions on single-family properties are included. The FHFA data are available in Haver's USECON database.
| FHFA U.S. House Price Index, Purchase Only (SA %) | Oct | Sep | Aug | Oct Y/Y | 2015 | 2014 | 2013 |
|---|---|---|---|---|---|---|---|
| Total | 0.4 | 0.6 | 0.8 | 6.2 | 5.7 | 5.4 | 7.3 |
| Pacific | 0.2 | 1.3 | 0.6 | 8.0 | 7.9 | 9.5 | 15.8 |
| Mountain | 1.2 | 0.6 | 0.5 | 8.3 | 7.9 | 7.2 | 12.3 |
| South Atlantic | 0.7 | 0.9 | 1.1 | 7.6 | 6.5 | 5.8 | 7.8 |
| West South Central | 0.1 | 0.9 | 0.6 | 5.9 | 6.4 | 5.6 | 6.0 |
| East South Central | -0.6 | 0.1 | 0.7 | 4.7 | 4.8 | 3.5 | 4.0 |
| West North Central | -0.2 | 0.6 | -0.1 | 4.9 | 4.4 | 4.1 | 4.8 |
| East North Central | 0.6 | 0.2 | 1.1 | 5.6 | 4.6 | 4.5 | 5.3 |
| Middle Atlantic | 0.3 | 0.1 | 0.6 | 3.6 | 2.8 | 2.2 | 2.7 |
| New England | 0.9 | 0.3 | 1.0 | 5.0 | 3.4 | 3.1 | 3.7 |
|
|
Carol Stone, CBE
AuthorMore in Author Profile »Carol Stone, CBE came to Haver Analytics in 2003 following more than 35 years as a financial market economist at major Wall Street financial institutions, most especially Merrill Lynch and Nomura Securities. She had broad experience in analysis and forecasting of flow-of-funds accounts, the federal budget and Federal Reserve operations. At Nomura Securities, among other duties, she developed various indicator forecasting tools and edited a daily global publication produced in London and New York for readers in Tokyo. At Haver Analytics, Carol was a member of the Research Department, aiding database managers with research and documentation efforts, as well as posting commentary on select economic reports. In addition, she conducted Ways-of-the-World, a blog on economic issues for an Episcopal-Church-affiliated website, The Geranium Farm. During her career, Carol served as an officer of the Money Marketeers and the Downtown Economists Club. She had a PhD from NYU's Stern School of Business. She lived in Brooklyn, New York, and had a weekend home on Long Island.
More Economy in Brief
 Global| Feb 05 2026
Charts of the Week: Balanced Policy, Resilient Data and AI Narratives
by:Andrew Cates


