 Global| Dec 27 2018
U.S. FHFA House Price Increases
Summary
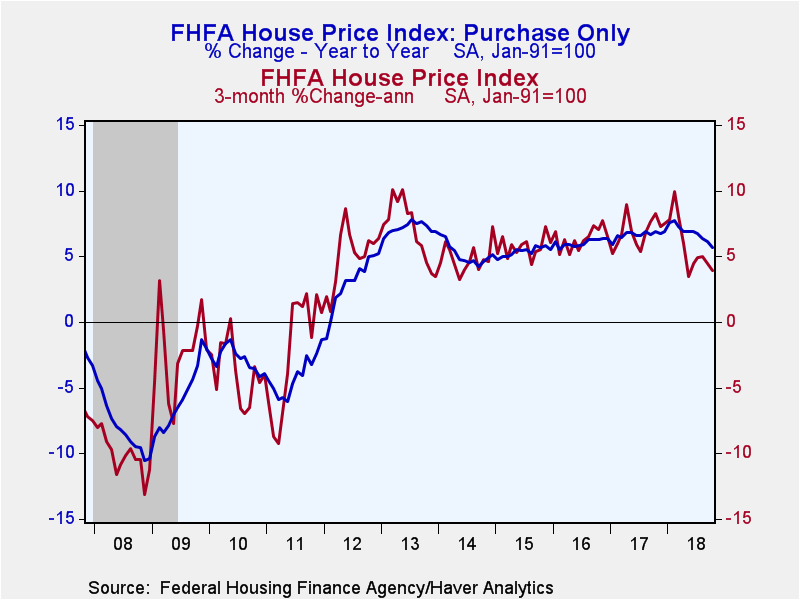
The Federal Housing Finance Agency (FHFA) Price Index for house purchases rose 0.3% (5.7% y/y) during October following a 0.2% September rise. Home price appreciation has eased noticeably this year. Over the past six months, the index [...]
The Federal Housing Finance Agency (FHFA) Price Index for house purchases rose 0.3% (5.7% y/y) during October following a 0.2% September rise. Home price appreciation has eased noticeably this year. Over the past six months, the index increased at a 4.4% annual rate, down from a 6.9% annual rate of increase six months earlier.
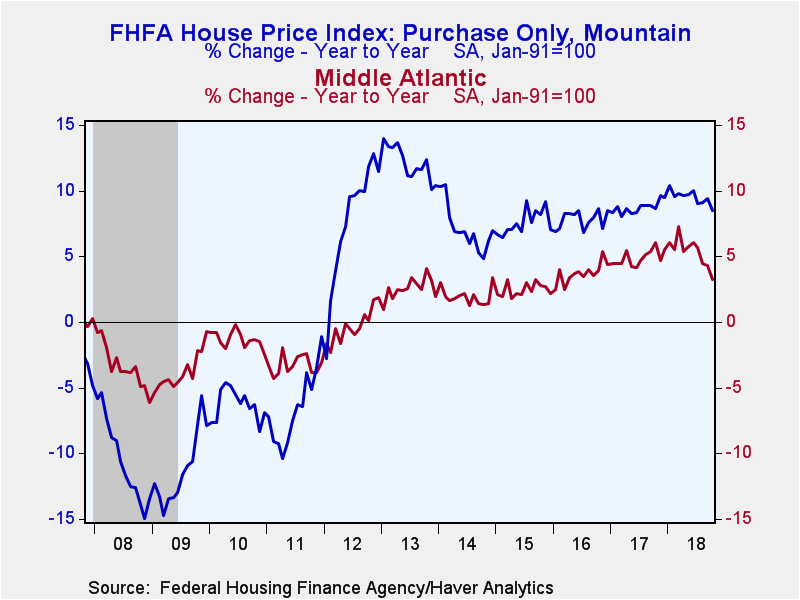
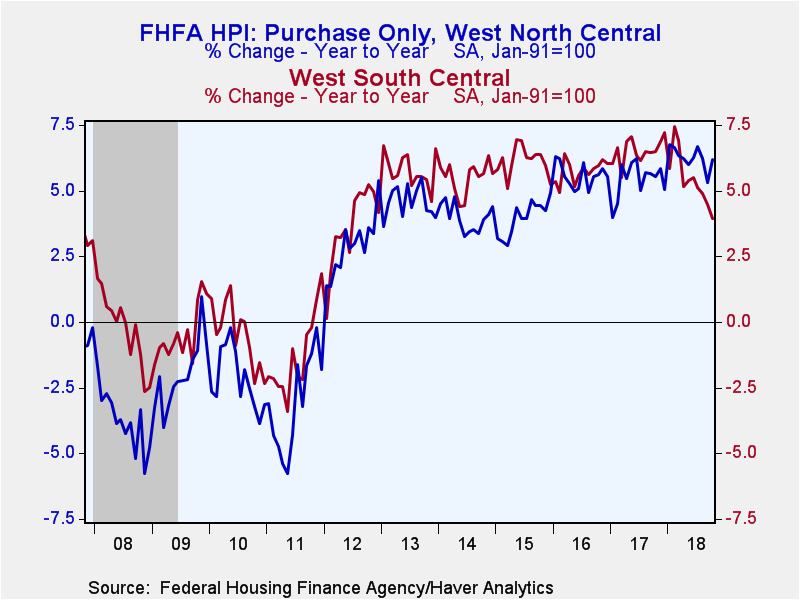
Most regions experienced a step-down in price gains this year, but the most pronounced decelerations were in the Middle Atlantic, South Atlantic and West South Central regions. In fact, in October, prices actually fell 0.2% in the Middle Atlantic region (+6.0% y/y) and 0.6% the South Atlantic region (-0.6%, +5.8% y/y), while prices were nearly stagnant in the West South Central region (+3.9% y/y).
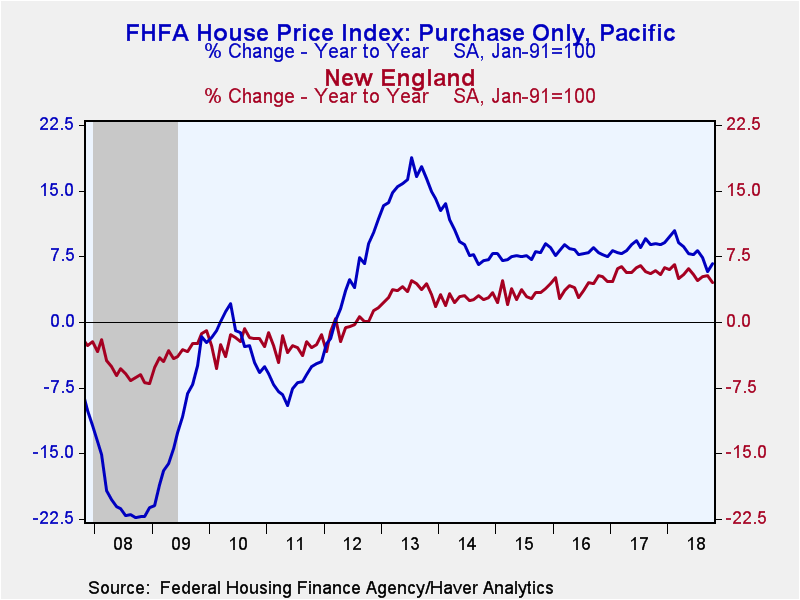
Prices in the Pacific region rebounded 1.4% in October (+6.7% y/y) after a surprising 0.8% decline in September, while the Mountain region added to previous strong gains (8.5% y/y). The East North Central region posted a firm 0.7% increase (6.6% y/y), and West North Central home prices bounced back 1.1% (6.2% y/y). East South Central prices increased 0.6% (4.3% y/y). In New England, home prices gained 0.3% (4.6% y/y).
The FHFA house price index is a weighted purchase-only index that measures average price changes in repeat sales of the same property. An associated quarterly index includes refinancings on the same kinds of properties. The indexes are based on transactions involving conforming, conventional mortgages purchased or securitized by Fannie Mae or Freddie Mac. Only mortgage transactions on single-family properties are included. The FHFA data are available in Haver's USECON database.
| FHFA U.S. House Price Index, Purchase Only (SA %) |
Oct | Sep | Aug | Oct Y/Y | 2017 | 2016 | 2015 |
|---|---|---|---|---|---|---|---|
| Total | 0.3 | 0.2 | 0.4 | 5.7 | 6.7 | 6.0 | 5.4 |
| New England | 0.3 | 0.5 | 0.6 | 4.6 | 5.8 | 4.1 | 3.3 |
| Middle Atlantic | -0.2 | 0.3 | -0.4 | 3.3 | 4.9 | 3.7 | 2.5 |
| East North Central | 0.7 | 0.7 | 0.4 | 6.6 | 6.1 | 5.3 | 4.3 |
| West North Central | 1.1 | -0.2 | 0.3 | 6.2 | 5.4 | 5.6 | 4.0 |
| South Atlantic | -0.6 | 0.5 | 0.5 | 5.8 | 6.9 | 6.9 | 6.1 |
| East South Central | 0.6 | 0.0 | 0.4 | 4.3 | 5.8 | 5.1 | 4.5 |
| West South Central | 0.1 | 0.1 | 0.4 | 3.9 | 6.5 | 5.7 | 6.1 |
| Mountain | 0.2 | 1.2 | 0.6 | 8.5 | 8.7 | 7.8 | 7.6 |
| Pacific | 1.4 | -0.8 | 0.7 | 6.7 | 8.7 | 8.0 | 7.7 |
New England: Maine, New Hampshire, Vermont,
Massachusetts, Rhode Island and Connecticut.
Middle Atlantic: New York, New Jersey and Pennsylvania.
East North Central: Michigan, Wisconsin, Illinois, Indiana and Ohio.
West North Central: North Dakota, South Dakota, Minnesota, Nebraska,
Iowa, Kansas and Missouri.
South Atlantic: Delaware, Maryland, D.C., Virginia, West Virginia,
North Carolina, South Carolina, Georgia and Florida.
East South Central: Kentucky, Tennessee, Mississippi and Alabama.
West South Central: Oklahoma, Arkansas, Texas and Louisiana.
Mountain: Montana, Idaho, Wyoming, Nevada, Utah, Colorado, Arizona and
New Mexico.
Pacific: Alaska, California, Hawaii, Oregon, Washington.
Peter D'Antonio
AuthorMore in Author Profile »Peter started working for Haver Analytics in 2016. He worked for nearly 30 years as an Economist on Wall Street, most recently as the Head of US Economic Forecasting at Citigroup, where he advised the trading and sales businesses in the Capital Markets. He built an extensive Excel system, which he used to forecast all major high-frequency statistics and a longer-term macroeconomic outlook. Peter also advised key clients, including hedge funds, pension funds, asset managers, Fortune 500 corporations, governments, and central banks, on US economic developments and markets. He wrote over 1,000 articles for Citigroup publications. In recent years, Peter shifted his career focus to teaching. He teaches Economics and Business at the Molloy College School of Business in Rockville Centre, NY. He developed Molloy’s Economics Major and Minor and created many of the courses. Peter has written numerous peer-reviewed journal articles that focus on the accuracy and interpretation of economic data. He has also taught at the NYU Stern School of Business. Peter was awarded the New York Forecasters Club Forecast Prize for most accurate economic forecast in 2007, 2018, and 2020. Peter D’Antonio earned his BA in Economics from Princeton University and his MA and PhD from the University of Pennsylvania, where he specialized in Macroeconomics and Finance.
More Economy in Brief
 Global| Feb 05 2026
Charts of the Week: Balanced Policy, Resilient Data and AI Narratives
by:Andrew Cates


