 Global| Oct 25 2004
U.S. Existing Home Sales Rebounded
by:Tom Moeller
|in:Economy in Brief
Summary
Existing single family home sales rebounded 3.1% in September to 6.75M following two months of decline that were little revised. Consensus expectations had been for a roughly unchanged reading at 6.54M. The figures reflect closings of [...]
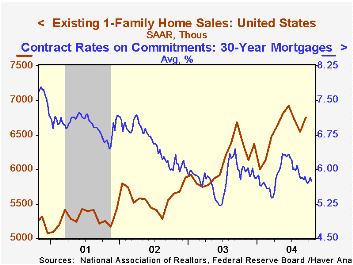
Existing single family home sales rebounded 3.1% in September to 6.75M following two months of decline that were little revised. Consensus expectations had been for a roughly unchanged reading at 6.54M.
The figures reflect closings of home sales in earlier months.
Sales rose across the nation except in the South where they fell for the second month (+0.8% y/y).
The median price of an existing home fell for the third consecutive month to $186,600 (+8.6% y/y), down 2.3% from the peak.
| Existing Home Sales (000, AR) | Sept | Aug | Y/Y | 2003 | 2002 | 2001 |
|---|---|---|---|---|---|---|
| Existing Single-Family | 6,750 | 6,550 | 1.0% | 6,098 | 5,593 | 5,290 |
by Tom Moeller October 25, 2004
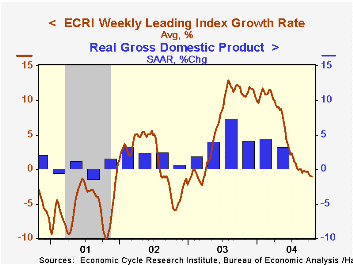
The Weekly Leading Index of the US economy published by the Economic Cycle Research Institute (ECRI) has remained roughly unchanged since July. That performance pulled the smoothed six-month growth rate in the index to negative 1.0%.
Past recessionary periods in the US economy were signaled by negative growth in the ECRI Leading Index in the -5 to -10% range. During the last ten years there has been a 69% correlation between the six-month growth in the ECRI leading index of the US economy and two quarter growth in real GDP.
The components of the ECRI weekly leading index are money supply plus stock & bond mutual funds, the JOC-ECRI industrial materials price index, mortgage applications, bond quality spreads, stock prices, bond yields, and initial jobless insurance claims.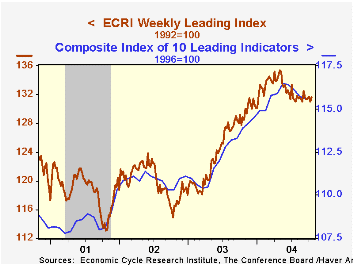
The ECRI Leading Index's recent pattern generally mirrors the Conference Board's Index of Leading Economic Indicators, with a slight lead. Construction of the ECRI Leading Index differs from the Conference Board Index but there has been a 70% correlation between the y/y percent change in the two series over the last 10 years.
The median lead of the ECRI index at business cycle peaks has been 10.5 months and at cycle troughs 3.0 months.
The latest from ECRI is available here.
| ECRI Leading Index | 10/15/04 | 10/08/04 | Growth Rate | 2003 | 2002 | 2001 |
|---|---|---|---|---|---|---|
| Weekly | 131.6 | 131.0 | -1.0% | 6.5% | 1.1% | -5.3% |
| Sept | Aug | |||||
| Monthly | 131.7 | 131.3 | -0.3% |

Tom Moeller
AuthorMore in Author Profile »Prior to joining Haver Analytics in 2000, Mr. Moeller worked as the Economist at Chancellor Capital Management from 1985 to 1999. There, he developed comprehensive economic forecasts and interpreted economic data for equity and fixed income portfolio managers. Also at Chancellor, Mr. Moeller worked as an equity analyst and was responsible for researching and rating companies in the economically sensitive automobile and housing industries for investment in Chancellor’s equity portfolio. Prior to joining Chancellor, Mr. Moeller was an Economist at Citibank from 1979 to 1984. He also analyzed pricing behavior in the metals industry for the Council on Wage and Price Stability in Washington, D.C. In 1999, Mr. Moeller received the award for most accurate forecast from the Forecasters' Club of New York. From 1990 to 1992 he was President of the New York Association for Business Economists. Mr. Moeller earned an M.B.A. in Finance from Fordham University, where he graduated in 1987. He holds a Bachelor of Arts in Economics from George Washington University.
More Economy in Brief


