 Global| Aug 25 2008
U.S. Existing Home Sales Highest Since February
by:Tom Moeller
|in:Economy in Brief
Summary
The level of existing homes rose 3.1% last month to 5.00 million. The figure, reported by the National Association of Realtors, more than made up a 2.8% decline during June and the rise lifted sales to the highest level since [...]
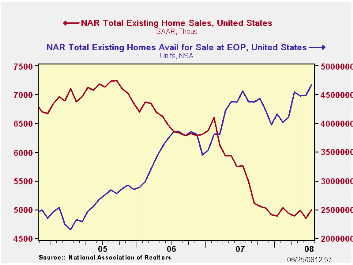
The level of existing homes rose 3.1% last month to 5.00 million. The figure, reported by the National Association of Realtors, more than made up a 2.8% decline during June and the rise lifted sales to the highest level since February. The figure was firmer than Consensus expectations for a selling rate of 4.91M homes. Total sales include sales of condos and co-ops.
Sales of existing single-family homes also made up (most) of their June decline and rose 3.1%. These sales (which have a longer history than the total) were still near the lowest level since early-1998.
By region, home sales in the West rose a sharp 9.7% (+0.9% y/y). They were up by more than one-quarter from last October's low. Sales in the Northeast also were firm and rose 5.9%. In the Midwest, however, sales posted only a modest 0.9% increase and in the South sales ticked 0.5% lower. These sales remained near the lowest level since 2000.
Median home prices last month reversed just some of their June rise with a 1.3% decline. Nevertheless, prices were up 8.6% from the February low.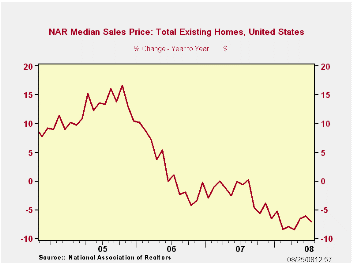
The number of unsold homes (condos & single-family) on the market rose 3.9% from June (2.4% y/y). At the current sales rate the inventory rose slightly to an 11.2 months supply which is the record high for this series. For single-family homes, however, the inventory was unchanged m/m (1.8% y/y) and that amounted to 10.6 months supply at the current sales rate. That was still near the highest supply since 1985.
Divorcing Money from Monetary Policy from the Federal Reserve Bank of New York can be found here.
Signal or Noise? Implications of the Term Premium for Recession Forecasting, also from the Federal Reserve Bank of New York, is available here.
| Existing Home Sales (Thous) | July | y/y % | June | July '07 | 2007 | 2006 | 2005 |
|---|---|---|---|---|---|---|---|
| Total | 5,000 | -13.2 | 4,850 | 5,760 | 5,672 | 6,508 | 7,076 |
| Northeast | 900 | -11.8 | 850 | 1,020 | 1,008 | 1,090 | 1,168 |
| Midwest | 1,120 | -17.0 | 1,110 | 1,350 | 1,331 | 1,491 | 1,589 |
| South | 1,850 | -18.1 | 1,860 | 2,260 | 2,240 | 2,576 | 2,704 |
| West | 1,130 | 0.9 | 1,030 | 1,120 | 1,093 | 1,353 | 1,617 |
| Single-Family | 4,390 | -12.4 | 4,260 | 5,010 | 4,958 | 5,703 | 6,181 |
| Median Price, Total, $ | 212,400 | -7.1 | 215,100 | 228,600 | 216,617 | 222,000 | 218,217 |

Tom Moeller
AuthorMore in Author Profile »Prior to joining Haver Analytics in 2000, Mr. Moeller worked as the Economist at Chancellor Capital Management from 1985 to 1999. There, he developed comprehensive economic forecasts and interpreted economic data for equity and fixed income portfolio managers. Also at Chancellor, Mr. Moeller worked as an equity analyst and was responsible for researching and rating companies in the economically sensitive automobile and housing industries for investment in Chancellor’s equity portfolio. Prior to joining Chancellor, Mr. Moeller was an Economist at Citibank from 1979 to 1984. He also analyzed pricing behavior in the metals industry for the Council on Wage and Price Stability in Washington, D.C. In 1999, Mr. Moeller received the award for most accurate forecast from the Forecasters' Club of New York. From 1990 to 1992 he was President of the New York Association for Business Economists. Mr. Moeller earned an M.B.A. in Finance from Fordham University, where he graduated in 1987. He holds a Bachelor of Arts in Economics from George Washington University.
More Economy in Brief


