 Global| Apr 30 2015
U.S. Employment Cost Index Firmer in Q1
Summary
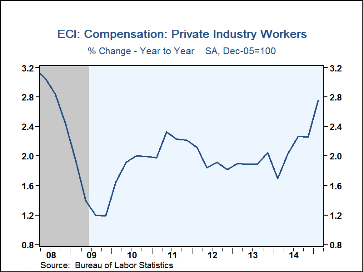
The employment cost index for private industry workers rose 0.7% (2.8% y/y) in Q1'15, following a 0.5% Q4 rise, revised from 0.6%. The Q1 number was stronger than expectations for a 0.5% rise, according to the Action Economics [...]
The employment cost index for private industry workers rose 0.7% (2.8% y/y) in Q1'15, following a 0.5% Q4 rise, revised from 0.6%. The Q1 number was stronger than expectations for a 0.5% rise, according to the Action Economics Forecast Survey.
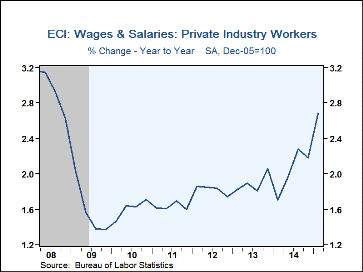
Wages & salaries of private industry workers were also up 0.7% (2.7% y/y) last quarter after their 0.5% Q4 rise. There was considerable variation among industry groups in Q1. Professional and business services were strongest, at 1.6% in the quarter and 4.0% year/year. Leisure & hospitality (2.4% y/y), financial activities (2.2% y/y) and "other" (2.2% y/y) were at 0.8% for the quarter. Educational services had a 0.7% gain (2.1% y/y), and manufacturing (2.3% y/y) and information services (2.1%) came at 0.6% in Q1. Construction workers had a 0.5% increase (2.0% y/y) and the trade, transportation and utilities group (3.0% y/y) and health and social assistance (2.1% y/y) were at 0.4%.
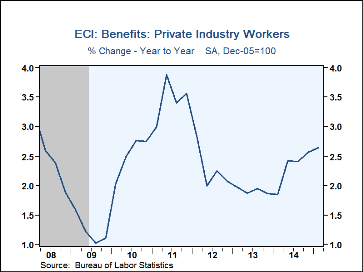
Benefit costs were up 0.6% (2.6% y/y) after 0.5% in Q4. Reported by occupational group, benefits for production, transportation and material-moving workers jumped 1.1% (2.5% y/y), management, professional and related staff saw an increase of 0.6% (3.0% y/y), and service occupations got 0.5% (1.7% y/y). Benefit gains were weaker at 0.1% for both sales and office workers (2.1% y/y) and natural resource, construction and maintenance workers (3.0% y/y).
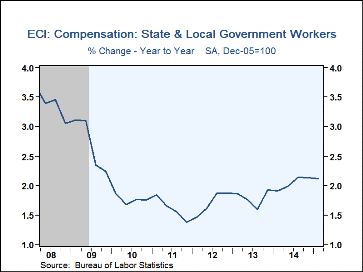
Total compensation for state & local government workers rose 0.5% (2.1% y/y) in Q1 after 0.6% in Q4. Education workers' compensation gained 0.6% (2.1% y/y), health care and social assistance 0.9% (2.5% y/y), and that for public administration workers went up just 0.2% (2.2% y/y).
The employment cost index figures are available in Haver's USECON database. Consensus estimates come from the Action Economics survey, carried in Haver's AS1REPNA database.
| ECI- Private Industry Workers (%) | Q1'15 | Q4'14 | Q3'14 | Q1 Y/Y | 2014 | 2013 | 2012 |
|---|---|---|---|---|---|---|---|
| Compensation | 0.7 | 0.5 | 0.7 | 2.8 | 2.1 | 1.9 | 1.9 |
| Wages & Salaries | 0.7 | 0.5 | 0.7 | 2.7 | 2.0 | 1.9 | 1.8 |
| Benefit Costs | 0.6 | 0.5 | 0.5 | 2.6 | 2.3 | 1.9 | 2.3 |
Carol Stone, CBE
AuthorMore in Author Profile »Carol Stone, CBE came to Haver Analytics in 2003 following more than 35 years as a financial market economist at major Wall Street financial institutions, most especially Merrill Lynch and Nomura Securities. She had broad experience in analysis and forecasting of flow-of-funds accounts, the federal budget and Federal Reserve operations. At Nomura Securities, among other duties, she developed various indicator forecasting tools and edited a daily global publication produced in London and New York for readers in Tokyo. At Haver Analytics, Carol was a member of the Research Department, aiding database managers with research and documentation efforts, as well as posting commentary on select economic reports. In addition, she conducted Ways-of-the-World, a blog on economic issues for an Episcopal-Church-affiliated website, The Geranium Farm. During her career, Carol served as an officer of the Money Marketeers and the Downtown Economists Club. She had a PhD from NYU's Stern School of Business. She lived in Brooklyn, New York, and had a weekend home on Long Island.
More Economy in Brief
 Global| Feb 05 2026
Charts of the Week: Balanced Policy, Resilient Data and AI Narratives
by:Andrew Cates


