 Global| Apr 15 2008
U.S. Empire State Index Stabilized
by:Tom Moeller
|in:Economy in Brief
Summary
The April index of manufacturing activity in New York State recovered to 0.63% following the sharp falloff in March to a reading of -22.2%. It was better than expectations for continued weakness at a level of -17%. The figure is a [...]
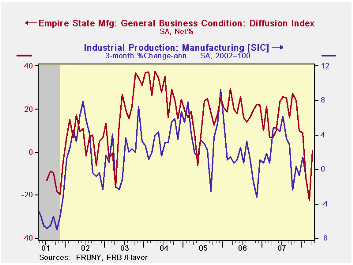
The April index of manufacturing activity in New York State recovered to 0.63% following the sharp falloff in March to a reading of -22.2%. It was better than expectations for continued weakness at a level of -17%. The figure is a diffusion index and it is reported by the Federal Reserve Bank of New York.
Since the series' inception in 2001 there has been a 55% correlation between the index level and the three month change in U.S. factory sector industrial production.
New orders, shipments and inventories each improved.
The employment index, however, deteriorated to a level of 0.00% from 4.49% in March. During all of 1Q08 the employment index averaged 1.61% versus 11.28% averaged during all of last year. In the (perhaps too) short six year history of the NY employment index, there has been an 85% correlation between it and the three month growth in overall factory sector employment.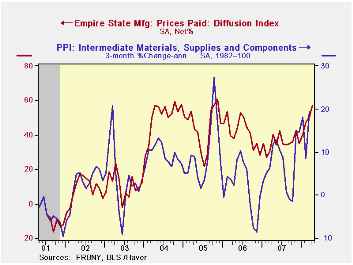
Like the Philadelphia Fed Index of General Business Conditions, the Empire State Business Conditions Index reflects answers to an independent survey question; it is not a weighted combination of the components.
Pricing pressure rose even further to an index level of 57.29, its highest since 2005. Since 2001 there has been an 81% correlation between the index of prices paid and the three month change in the core intermediate materials PPI.
The Empire State index of expected business conditions in six months fell to a reading near the recession low during 2001.
The Empire State Manufacturing Survey is a monthly survey of manufacturers in New York State conducted by the Federal Reserve Bank of New York. Participants from across the state in a variety of industries respond to a questionnaire and report the change in a variety of indicators from the previous month. Respondents also state the likely direction of these same indicators six months ahead. April 2002 is the first report, although survey data date back to July 2001.For more on the Empire State Manufacturing Survey, including methodologies and the latest report, click here.
The Industrial Revolution and the Demographic Transition from the Federal Reserve Bank of Philadelphia is available here.
| Empire State Manufacturing Survey | April | March | April '07 | 2007 | 2006 | 2005 |
|---|---|---|---|---|---|---|
| General Business Conditions (diffusion index, %) | 0.63 | -22.23 | 7.00 | 17.23 | 20.24 | 15.53 |
| Prices Paid | 57.29 | 50.56 | 40.48 | 35.64 | 41.88 | 44.74 |

Tom Moeller
AuthorMore in Author Profile »Prior to joining Haver Analytics in 2000, Mr. Moeller worked as the Economist at Chancellor Capital Management from 1985 to 1999. There, he developed comprehensive economic forecasts and interpreted economic data for equity and fixed income portfolio managers. Also at Chancellor, Mr. Moeller worked as an equity analyst and was responsible for researching and rating companies in the economically sensitive automobile and housing industries for investment in Chancellor’s equity portfolio. Prior to joining Chancellor, Mr. Moeller was an Economist at Citibank from 1979 to 1984. He also analyzed pricing behavior in the metals industry for the Council on Wage and Price Stability in Washington, D.C. In 1999, Mr. Moeller received the award for most accurate forecast from the Forecasters' Club of New York. From 1990 to 1992 he was President of the New York Association for Business Economists. Mr. Moeller earned an M.B.A. in Finance from Fordham University, where he graduated in 1987. He holds a Bachelor of Arts in Economics from George Washington University.
More Economy in Brief


