 Global| Oct 29 2008
U.S. Durable Goods Orders Ticked Up
by:Tom Moeller
|in:Economy in Brief
Summary
During September, new orders for durable goods ticked up 0.8% after falling 5.5% during August, a decline revised from the -4.5% figure reported initially. Though the September rise in orders beat Consensus expectations for a 1.0% [...]
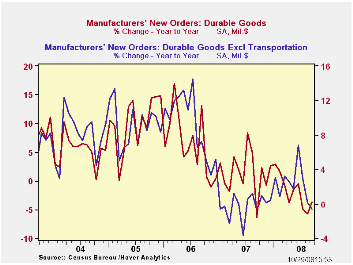
During September, new orders for durable goods ticked up 0.8% after falling 5.5% during August, a decline revised from the -4.5% figure reported initially. Though the September rise in orders beat Consensus expectations for a 1.0% decline, there where few, if any, areas of strength. The gain mostly reflected a 21.8% (-16.6% y/y) jump in new orders for aircraft & parts that offset most of a decline during August. (Nondefense aircraft orders rose 29.7% (-34.1% y/y).
Highlighting the weakness in durable goods orders last month was a 1.1% decline in new orders less the transportation sector altogether. That followed a 4.1% drop during August, initially reported at down 3.0%. The September decline about matched Consensus expectations but during the last three months, orders less the transportation sector fell at a 19.0% annual rate.
The rise in aircraft orders did lift overall orders for nondefense capital goods by 0.8%, but that followed a little-revised 7.7% plunge during August. Without aircraft, nondefense capital goods orders fell 1.4% after 2.2% drop during August. These declines lowered the three-month growth rate to -12.4%, the worst since early last year. During the last ten years there has been an 80% correlation between the y/y gain in nondefense capital goods orders and the rise in equipment & software spending in the GDP accounts. The correlation of the GDP figure with capital goods shipments is, as one would expect, a larger 92%.
The industry detail highlights the recent weakness in factory orders. Orders for machinery ticked up just 0.5% after a 6.4% drop during August. That left the three-month growth rate at -9.5%.Primary metals orders fell sharply for the second consecutive month with a 4.5% (+1.6% y/y) drop which followed a downwardly revised 12.5% August plunge. New orders for electrical equipment increased 1.5% (1.1% y/y) after a 3.5% August decline. On a three-month basis these orders were down at a 35.0% annual rate.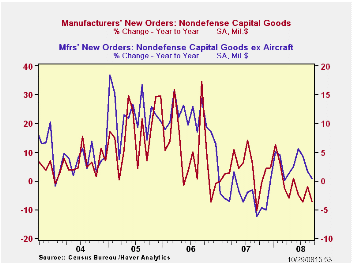
New orders for computers & electronic products continued on their weaker trend-line with a 1.4% drop last month. On a three-month basis these orders fell at a 15.0% annual rate after their 2.1% decline during all of last year. Orders for just computers & related products fell 2.8% and on a three-month basis they were off at a 47.9% annual rate. New orders for communications equipment also have been quite weak and they fell 14.6% last month. Three-month growth was -36.6% (AR) after last year's 7.5% decline.
Reflecting past weakness in new orders was a 0.2% rise in overall shipments of durable goods which made up little of a 4.2% August fall. During the last three months growth was a negative 7.6% (AR) after last year's negligible 0.1% uptick. For comparison, industrial production of durable goods during the last three months fell at a 13.5%. During the last ten years there has been a 62% correlation between the three-month change in shipments of durable goods and the change in durables industrial production. Less transportation, shipments of durable goods fell 0.4% following a 2.9% August drop. Three-month growth fell to -4.8% (AR).
Inventories of durable goods rose just 0.4% (8.1% y/y), the weakest monthly increase since last October. Three-month growth eased slightly to a still strong 8.8%. Less transportation, inventories rose a weaker 0.5% and the three-month growth rate eased slightly to 9.4% (AR) after the 1.4% rise during 2007.
Addressing the Credit Crisis is a speech given earlier this month by Dallas Fed President Richard W. Fisher and it can be found here.
| NAICS Classification (%) | September | August | Y/Y | 2007 | 2006 | 2005 |
|---|---|---|---|---|---|---|
| Durable Goods Orders | 0.8 | -5.5 | -3.6 | 1.4 | 6.2 | 10.2 |
| Excluding Transportation | -1.1 | -4.1 | -0.6 | -0.3 | 9.1 | 9.1 |
| Nondefense Capital Goods | 0.8 | -7.7 | -7.2 | 3.5 | 9.4 | 17.3 |
| Excluding Aircraft | -1.4 | -2.2 | 0.5 | -2.7 | 10.7 | 11.6 |

Tom Moeller
AuthorMore in Author Profile »Prior to joining Haver Analytics in 2000, Mr. Moeller worked as the Economist at Chancellor Capital Management from 1985 to 1999. There, he developed comprehensive economic forecasts and interpreted economic data for equity and fixed income portfolio managers. Also at Chancellor, Mr. Moeller worked as an equity analyst and was responsible for researching and rating companies in the economically sensitive automobile and housing industries for investment in Chancellor’s equity portfolio. Prior to joining Chancellor, Mr. Moeller was an Economist at Citibank from 1979 to 1984. He also analyzed pricing behavior in the metals industry for the Council on Wage and Price Stability in Washington, D.C. In 1999, Mr. Moeller received the award for most accurate forecast from the Forecasters' Club of New York. From 1990 to 1992 he was President of the New York Association for Business Economists. Mr. Moeller earned an M.B.A. in Finance from Fordham University, where he graduated in 1987. He holds a Bachelor of Arts in Economics from George Washington University.
More Economy in Brief


