 Global| Aug 27 2008
U.S. Durable Goods Orders Surged Again
by:Tom Moeller
|in:Economy in Brief
Summary
For the second month in a row, new orders for durable goods jumped 1.3%. Last month's increase was led by a surge in orders for commercial aircraft, and the June gain in total orders was upwardly revised. Consensus expectations had [...]
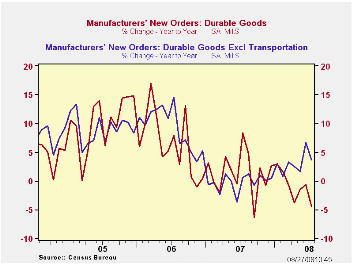
For the second month in a row, new orders for durable goods jumped 1.3%. Last month's increase was led by a surge in orders for commercial aircraft, and the June gain in total orders was upwardly revised. Consensus expectations had been for no change in the level of July new orders. Less transportation orders rose 0.7% during July and they have risen 3.6% during the past twelve months.
Volatile orders for aircraft & parts have had an
outsized effect on overall new orders for durables. They rose 21.6%
(-24.8% y/y) in July after a 17.7% June drop. The nondefense portion of
those orders account for most of the extreme volatility as they rose
28.0% (-37.2% y/y) last month after a 21.3% June slump.
Orders for nondefense capital goods recouped their June decline with a 6.3% jump. The volatile aircraft orders had it's outsized effect on the total, but there was strength, elsewhere, nonetheless. Less aircraft nondefense capital goods orders jumped 2.6% after a 1.3% rise during June. These orders have risen 4.0% since yearend '07 and that is a recovery from the 2.7% decline during all of last year. During the last ten years there has been an 80% correlation between the y/y gain in nondefense capital goods orders and the rise in equipment & software spending in the GDP accounts. The correlation with capital goods shipments is, as one would expect, a larger 92%.
Continuing firm were orders for machinery as they rose 4.6%
(8.6% y/y) after the 2.8% increase during June. Year-to-date machinery
orders are up 6.6%.Primary metals orders also have been strong and they
posted a 2.2% (18.3% y/y) increase last month after their 7.8% June
pop. New orders for electrical equipment did fall 6.0% (+5.5 y/y) last
month and that reversed a 5.0% gain during June. The year-to-date gain
in these orders, however, of 3.5% is about the same as during all of
last year.
Failing to show strength were orders for computers & electronic products. They fell 1.3% (-1.9% y/y) after a 0.1% slip during June. So far this year these orders have risen just 0.3% after the 2.1% decline last year. Orders for just computers & related products fell 10.7% (-9.3% y/y) after the 4.7% skid during June. New orders for communications equipment made up some of that weakness with a 2.9% July rise (-6.6% y/y). They are up 0.4% so far this year.
Overall shipments of durable goods jumped 2.5% (-0.4% y/y) after their 0.9% June gain. So far this year these shipments are up 3.3% after last year's negligible 0.1% uptick. For comparison, industrial production of durable goods this year is down 0.7% (-0.8% y/y). During the last ten years there has been a 79% correlation between the y/y change in shipments of durable goods and the change in durables industrial production. Less transportation, shipments of durable goods rose 2.0% (3.5% y/y) after a 0.5% uptick during June
Inventories of durable goods continued strong and they rose 0.8% (7.1% y/y), the same as they did during June. Year-to-date these inventories increased 4.7%, a slight acceleration from the 3.5% rise last year. Less transportation, inventories continued firm and they also rose 0.8% (5.0% y/y) after their 1.4% rise during 2007.
The Minutes of the Federal Open Market Committee Meeting held on August 5, 2008 can be found here.
| NAICS Classification | July | June | Y/Y | 2007 | 2006 | 2005 |
|---|---|---|---|---|---|---|
| Durable Goods Orders | 1.3 | 1.3 | -4.5 | 1.4 | 6.2 | 10.2 |
| Excluding Transportation | 0.7 | 2.4 | 3.6 | -0.3 | 9.1 | 9.1 |
| Nondefense Capital Goods | 6.3 | -2.6 | -5.2 | 3.5 | 9.4 | 17.3 |
| Excluding Aircraft | 2.6 | 1.3 | 6.3 | -2.7 | 10.7 | 11.6 |
by Robert Brusca August 27 2008
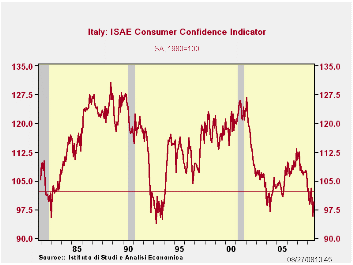
Consumer confidence rebounded in Italy to 99.5 In August from
95.8 in July. This is a nice bounce but it still leaves the index at a
very low level. The best guess is that the pop in confidence stems from
the drop in global oil prices and the positive impact that has on short
term consumer budgets. Price trends over the next 12 months improved
slightly this month (to 23 from 23.5) and past price trends were
assessed as a lot lower this month as oil prices broke. The drop in
expected price trends is the first break in the uptrend in two months.
The overall situation is assessed as better at a reading of
-30 up from -35 last month. But that reading is still in the 14th
percentile of its historic range, a weak position. The household budget
improved sharply month-to-month, most likely the result of lower energy
costs. Its improvement to +2 from -7 elevates it to the 22nd percentile
of its range, still weak but less severe. It’s the biggest one-month
shift in this category since at least December of 1998, although shifts
of 8 points m/m have been recorded. As you might expect if the sharp
drop in world oil prices is behind the improvement in sentiment
spending plans would not be changing much even though the budgets show
more breathing room, since oil will not help all that much with big
ticket purchases compared to monthly needs. Here we find major purchase
plans fell over the next 12 months to -70 from -67 in July and stand in
the bottom 10 percentile of their range since Dec 1998. This helps to
point the finger for improvement at lower oil and at the same time
raises a cautionary note about getting too hopeful on the notion that
Italy has reached a turning point.
On balance the shifts in the ISAE survey of consumer
confidence are consistent with the notion that dropping energy prices
may be the catalyst for improved sentiment. The house hold budget feels
some relief and that improves the overall situation somewhat, but the
unemployment expectations and purchase plans are hardly affected.
Europe is still caught in the grip of a slowdown. And, lower
energy prices could help to temporarily mollify consumers. Still, Italy
has been weak for some time. It has no special remedy in place to boost
its economy. Meanwhile, as surrounding nations are getting weaker,
Italy is increasingly challenged. This situation promises to make
Italian consumers worse off before they become better off. This month’s
improvement does not seem to be part of a trend as much as it reflects
a one-off reaction to cheaper oil.
Still Italy’s result suggests we may see more widespread
improvement throughout the e-Zone this month.
Oil prices have a more limited impact to improve sentiment in
Europe given high energy taxes. Compared to the US where at-the-pump
fuel prices will move more when world spot oil prices change, energy
shifts can be expected to boost sentiment less in Europe. So whatever
improvement in sentiment we might see this month in Europe, we should
not expect the improvement to be too dramatic and perhaps not even
lasting as deteriorating economic circumstances eventually catch up
with euro-consumers.
| Italy ISAE Consumer Confidence | ||||||||||
|---|---|---|---|---|---|---|---|---|---|---|
| Since December 1998 | ||||||||||
| Aug 08 |
Jul 08 |
Jun 08 |
May 08 |
%tile | Rank | Max | Min | Range | Mean | |
| Consumer Confidence | 99.5 | 95.8 | 99.9 | 103.1 | 11.9 | 112 | 127 | 96 | 31 | 111 |
| Last 12 months | ||||||||||
| OVERALL SITUATION | -79 | -84 | -82 | -81 | 9.5 | 109 | -22 | -85 | 63 | -56 |
| PRICE TRENDS | -11.5 | -16 | -11 | -15 | 57.7 | 55 | 4 | -32 | 36 | -14 |
| Next 12months | ||||||||||
| OVERALL SITUATION | -30 | -35 | -16 | -9 | 14.3 | 107 | 24 | -39 | 63 | -13 |
| PRICE TRENDS | 23 | 23.5 | 19.5 | 19 | 46.9 | 52 | 49 | 0 | 49 | 22 |
| UNEMPLOYMENT | 7 | 8 | -5 | -3 | 94.9 | 4 | 9 | -30 | 39 | -5 |
| HOUSEHOLD BUDGET | 2 | -7 | -1 | -3 | 22.5 | 107 | 33 | -7 | 40 | 14 |
| HOUSEHOLD FIN SITUATION | ||||||||||
| Last 12 months | -50 | -56 | -55 | -53 | 12.2 | 111 | -7 | -56 | 49 | -30 |
| Next12 months | -19 | -20 | -15 | -10 | 2.9 | 116 | 14 | -20 | 34 | -2 |
| HOUSEHOLD SAVINGS | ||||||||||
| Current | 73 | 75 | 73 | 68 | 96.4 | 2 | 75 | 20 | 55 | 40 |
| Future | -41 | -44 | -38 | -38 | 17.9 | 112 | -9 | -48 | 39 | -24 |
| MAJOR Purchases | ||||||||||
| Current | -55 | -56 | -64 | -51 | 18.4 | 112 | -15 | -64 | 49 | -40 |
| Future | -70 | -67 | -69 | -56 | 9.7 | 104 | -42 | -73 | 31 | -62 |
| Total number of months: | 117 | |||||||||

Tom Moeller
AuthorMore in Author Profile »Prior to joining Haver Analytics in 2000, Mr. Moeller worked as the Economist at Chancellor Capital Management from 1985 to 1999. There, he developed comprehensive economic forecasts and interpreted economic data for equity and fixed income portfolio managers. Also at Chancellor, Mr. Moeller worked as an equity analyst and was responsible for researching and rating companies in the economically sensitive automobile and housing industries for investment in Chancellor’s equity portfolio. Prior to joining Chancellor, Mr. Moeller was an Economist at Citibank from 1979 to 1984. He also analyzed pricing behavior in the metals industry for the Council on Wage and Price Stability in Washington, D.C. In 1999, Mr. Moeller received the award for most accurate forecast from the Forecasters' Club of New York. From 1990 to 1992 he was President of the New York Association for Business Economists. Mr. Moeller earned an M.B.A. in Finance from Fordham University, where he graduated in 1987. He holds a Bachelor of Arts in Economics from George Washington University.
More Economy in Brief


