 Global| Dec 17 2008
U.S. Current Account Deficit in 3Q'08 Narrowed
by:Tom Moeller
|in:Economy in Brief
Summary
The US current account deficit narrowed last quarter to $174.1 billion from a slightly revised $180.9 billion during 2Q. The 3Q deficit was shallower than the Consensus expectation for a reading of $179 billion. As a percentage of GDP [...]
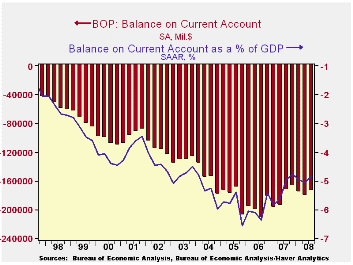
The US current account deficit narrowed last quarter to $174.1 billion from a slightly revised $180.9 billion during 2Q. The 3Q deficit was shallower than the Consensus expectation for a reading of $179 billion.
As a percentage of GDP the deficit shrank to 4.8%, near the shallowest since 2004. It is reduced from the peak percentage reached late in 2005 of 6.6% of GDP.
The 3Q deficit on goods trade narrowed to $214.7 billion and
it has been steady since 2005. Lower oil prices and a weaker U.S.
economy held import growth to just 1.4%. Export growth also slowed
sharply to 2.7% as foreign economies weakened as well. 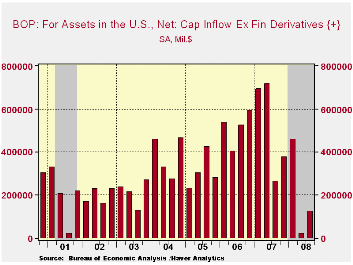
The balance on services trade grew to a record $38.2B. The lower dollar helped raise travel exports by 16.7% y/y while imports grew 4.8%. Passenger fare exports grew 29.6% y/y while imports rose 11.1%.
From the capital account, there was a small net inflow of funds of $9.5B versus a net outflow of $17.5B a year ago. The surplus is, however, down sharply from the peak. The deficit on U.S. private direct investment narrowed to it's least since early last year as U.S. investment grew but foreign investment fell.
The Credit Crunch of 2007-2008: A Discussion of the Background, Market Reactions, and Policy Responses from the Federal Reserve Bank of St. Louis is available here.
| US Balance of Payments SA | 3Q '08 | 2Q '08 | Year Ago | 2007 | 2006 | 2005 |
|---|---|---|---|---|---|---|
| Current Account Balance ($ Bil.) | -174.1 | -180.9 | -175.0 | -731.2 | -788.1 | -729.0 |
| Deficit % of GDP | -4.8 | -5.1 | -5.0 | -5.3 | -6.0 | -5.9 |
| Balance on Goods ($ Bil.) | -214.7 | -216.3 | -201.2 | -819.4 | -838.3 | -787.1 |
| Exports | 2.7% | 6.1% | 17.3% | 12.3% | 14.4% | 10.8% |
| Imports | 1.4% | 4.7% | 13.0% | 5.7% | 10.7% | 13.9% |
| Balance on Private Services ($ Bil.) | 38.2 | 36.2 | 33.1 | 119.1 | 85.0 | 75.6 |
| Exports | 3.1% | 3.3% | 10.2% | 14.6% | 11.5% | 10.2% |
| Imports | 2.4% | 2.0% | 8.4% | 8.4% | 11.3% | 7.7% |
| Balance on Income ($ Bil.) | 30.8 | 28.2 | 23.0 | 81.8 | 57.2 | 67.2 |
| Unilateral Transfers ($ Bil.) | -28.4 | -29.0 | -27.8 | -112.7 | -92.0 | -89.8 |
by Tom Moeller December 17, 2008
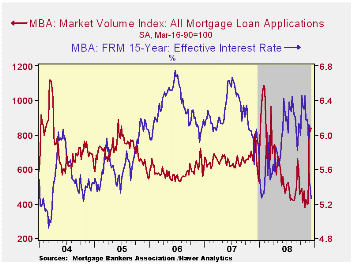
According to the Mortgage Bankers Association, the total number of mortgage applications increased 5.6% last week and that recovered most of the prior week's decline. Applications remained firm to take advantage of lower interest rates and the Fed's announcement that it would buy the debt of government sponsored enterprises (GSE) and mortgage-backed securities (MBS).
The index of applications to refinance a home mortgage surged
10.3% after having slipped 0.9% during the prior period. They have
risen by three times due to lower interest rates and the government's
guarantee.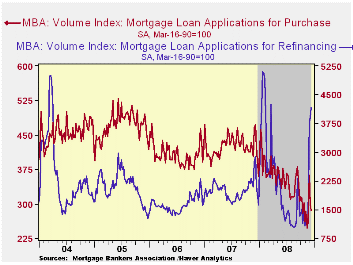
Off 4.0%, applications for a mortgage to purchase a home fell for the second week.
The effective interest rate on a conventional 15-year mortgage dipped again to 5.26% and that left them down a full percentage point from the October average. For a 30-year mortgage rates also fell to 5.41%. Interest rates on 15 and 30 year mortgages are closely correlated (>90%) with the rate on 10-year Treasury securities. For an adjustable rate 1-Year mortgage the rate slipped to 6.71% after having averaged 6.90% during October and November.
During the last ten years there has been a (negative) 79% correlation between the level of applications for purchase and the effective interest rate on a 30-year mortgage. Moreover, during the last ten years there has been a 61% correlation between the y/y change in purchase applications and the change in new plus existing single family home sales.
The Mortgage Bankers Association surveys between 20 to 35 of the top lenders in the U.S. housing industry to derive its refinance, purchase and market indexes. The weekly survey covers roughly 50% of all U.S. residential mortgage applications processed each week by mortgage banks, commercial banks and thrifts. Visit the Mortgage Bankers Association site here.
The figures for weekly mortgage applications are available in Haver's SURVEYW database.
| MBA Mortgage Applications (3/16/90=100) | 12/12/08 | 12/05/08 | Y/Y | 2007 | 2006 | 2005 |
|---|---|---|---|---|---|---|
| Total Market Index | 841.4 | 796.8 | 28.7% | 652.6 | 584.2 | 708.6 |
| Purchase | 286.1 | 298.1 | -32.2% | 424.9 | 406.9 | 470.9 |
| Refinancing | 4,156.0 | 3,767.3 | 30.8% | 1,997.9 | 1,634.0 | 2,092.3 |
by Robert Brusca December 17, 2008
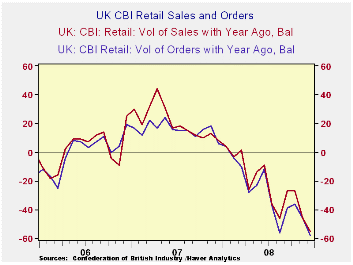
Our series on UK retail sales goes back to 1986. On that basis
the current retail sales metrics are largely at their lowest for the
entire series across measures except for inventories.
Inventory-to-sales ratios are high, in the top 25% of their range for
the period. At -55 in December the retail survey plunged from an
already weak reading of -46 in November. Orders have plunged to a
reading of-58 from -46 in November. Sales for the ‘time of year’ at -50
are much worse in December than they were in November at -42.
Expected sales are weak as well. This is not just a
flash-in-the-pan bad December. Expected sales are at a reading of -49
for January compared to a -40 for December. Expected orders are a weak
-48 in January compared to -41 in December, and so on.
The net readings that ultimate have been posted for December
are a sharp deterioration from December’s expectations. Since December
turned out to be much worse than expectations for it, what of January?
January already has poor expectation set. After September and October
sales were better than what had been expected November and December
have been substantially worse. If this string continues it will be a
dismal January, indeed.
| UK Retail volume data CBI Survey | |||||||||
|---|---|---|---|---|---|---|---|---|---|
| Reported: | Jan-09 | Dec-08 | Nov-08 | Oct-08 | 12MO Avg | Pcntle | Max | Min | Range |
| Sales/Yr Ago | -55 | -46 | -27 | -24 | 0% | 66 | -55 | 121 | |
| Orders/Yr Ago | -58 | -46 | -36 | -29 | 0% | 48 | -58 | 106 | |
| Sales: Time/Yr | -50 | -42 | -35 | -31 | 0% | 41 | -50 | 91 | |
| Stocks:Sales | 23 | 19 | 17 | 18 | 77% | 30 | 0 | 30 | |
| Expected: | Jan-09 | ||||||||
| Sales/Yr Ago | -49 | -40 | -25 | -30 | -19 | 0% | 67 | -49 | 116 |
| Orders/Yr Ago | -48 | -41 | -30 | -39 | -22 | 0% | 47 | -48 | 95 |
| Sales: Time/Yr | -51 | -38 | -31 | -44 | -27 | 0% | 45 | -51 | 96 |
| Stocks:Sales | 20 | 17 | 12 | 18 | 15 | 74% | 26 | 3 | 23 |
| Since Sept 1986 | |||||||||

Tom Moeller
AuthorMore in Author Profile »Prior to joining Haver Analytics in 2000, Mr. Moeller worked as the Economist at Chancellor Capital Management from 1985 to 1999. There, he developed comprehensive economic forecasts and interpreted economic data for equity and fixed income portfolio managers. Also at Chancellor, Mr. Moeller worked as an equity analyst and was responsible for researching and rating companies in the economically sensitive automobile and housing industries for investment in Chancellor’s equity portfolio. Prior to joining Chancellor, Mr. Moeller was an Economist at Citibank from 1979 to 1984. He also analyzed pricing behavior in the metals industry for the Council on Wage and Price Stability in Washington, D.C. In 1999, Mr. Moeller received the award for most accurate forecast from the Forecasters' Club of New York. From 1990 to 1992 he was President of the New York Association for Business Economists. Mr. Moeller earned an M.B.A. in Finance from Fordham University, where he graduated in 1987. He holds a Bachelor of Arts in Economics from George Washington University.
More Economy in Brief


