 Global| Mar 12 2003
U.S. Current Account Deficit Improved
by:Tom Moeller
|in:Economy in Brief
Summary
The US current account deficit narrowed to $127.5B in 4Q, the shallowest in over a year. The deficit for all of 2003 of $541.8B by far set a new record and totaled 4.9% of GDP. Consensus expectations had been for a 4Q deficit of [...]
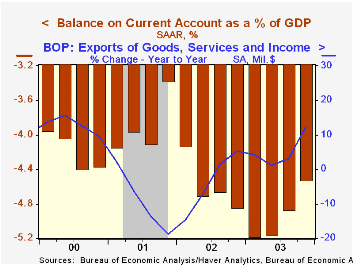
The US current account deficit narrowed to $127.5B in 4Q, the shallowest in over a year. The deficit for all of 2003 of $541.8B by far set a new record and totaled 4.9% of GDP. Consensus expectations had been for a 4Q deficit of $136.0B.
The deficit in goods trade improved to $110.4B in 4Q03 but for the year deteriorated to $473.5B.
Exports of goods, services & income in 4Q jumped 8.1% (12.4% y/y) led by a 10.2% pop in merchandise exports. Imports rose 4.0% with merchandise imports up just 4.3%, the gain held back by just a 1.0% q/q gain in petroleum prices.
The surplus on services expanded to $16.3B and for 2003 totaled $59.2B versus $64.8B in 2002. The peak services surplus was $91.1B in 1997.
| US Int'l Balance of Payments | 4Q '03 | 3Q '03 | Y/Y | 2003 | 2002 | 2001 |
|---|---|---|---|---|---|---|
| Current Account Deficit | $127.5B | $135.3B | $128.6B | $541.8B | $480.9B | $393.7B |
| Goods/Services/Income Deficit | $110.4B | $118.6B | $113.2B | $473.5B | $422.0B | $347.1B |
| Exports | 8.1% | 3.9% | 12.4% | 5.3% | -4.3% | -9.3% |
| Imports | 4.0% | 1.8% | 8.4% | 7.0% | 1.2% | -7.9% |
| Unilateral Transfers Deficit | $17.2B | $16.7B | $15.4B | $68.3 | $58.9B | $46.6B |
by Tom Moeller March 12, 2004
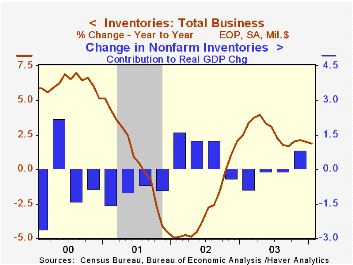
Total business inventories rose just 0.1% in January versus Consensus expectations for a 0.3% increase. It was the smallest increase since inventories began moving higher in September.
During the last ten years there has been a 45% correlation between the three month change in business inventories and the three month change in US factory production.
Retail inventories rose 0.1% in January, held back by a slight decline in non-auto inventories, the first decline since last May. The decline centered in apparel as well as furniture & Home furnishings.
Overall business sales rose 0.4% (6.4% y/y) following an upwardly revised 1.4% gain December.
The inventory-to-sales ratio was unchanged at a record low 1.33.
| Business Inventories | Jan | Dec | Y/Y | 2003 | 2002 | 2001 |
|---|---|---|---|---|---|---|
| Total | 0.1% | 0.3% | 1.9% | 2.0% | 2.1% | -4.6% |
| Retail | 0.1% | 0.3% | 4.5% | 5.1% | 7.5% | -2.9% |
| Retail excl. Autos | -0.0% | 0.4% | 3.3% | 3.4% | 2.4% | -1.2% |
| Wholesale | 0.1% | 0.6% | 2.5% | 2.2% | 0.4% | -4.5% |
| Manufacturing | 0.2% | 0.1% | -1.1% | -1.3% | -1.8% | -6.1% |
by Tom Moeller March 12, 2004
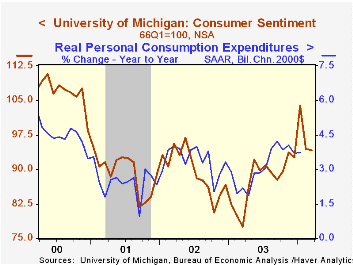
The University of Michigan’s consumer sentiment index slipped further in mid-March to 94.1 from 94.4 in February. Consensus expectations had been for an unchanged reading of 94.5.
During the last ten years there has been an 76% correlation between the level of consumer sentiment and the y/y change in real PCE. That correlation has risen to 84% during the last five years.
Perceptions of current economic conditions improved and added to gains in late February. The index came in at 105.7 and is up 17.4% versus last year.
The expectations index deteriorated again to 86.6 and added to last month's decline. Nevertheless, the index remained up 24.4% versus last year.
The University of Michigan survey is not seasonally adjusted.It is based on telephone interviews with 250 households nationwide on personal finances and business and buying conditions. The survey is expanded to a total of 500 interviews at month end.
| University of Michigan | Mid-March | Feb | Y/Y | 2003 | 2002 | 2001 |
|---|---|---|---|---|---|---|
| Consumer Sentiment | 94.1 | 94.4 | 21.3% | 87.6 | 89.6 | 89.2 |
| Current Conditions | 105.7 | 103.6 | 17.4% | 97.2 | 97.5 | 100.1 |
| Consumer Expectations | 86.6 | 88.5 | 24.4% | 81.4 | 84.6 | 82.3 |

Tom Moeller
AuthorMore in Author Profile »Prior to joining Haver Analytics in 2000, Mr. Moeller worked as the Economist at Chancellor Capital Management from 1985 to 1999. There, he developed comprehensive economic forecasts and interpreted economic data for equity and fixed income portfolio managers. Also at Chancellor, Mr. Moeller worked as an equity analyst and was responsible for researching and rating companies in the economically sensitive automobile and housing industries for investment in Chancellor’s equity portfolio. Prior to joining Chancellor, Mr. Moeller was an Economist at Citibank from 1979 to 1984. He also analyzed pricing behavior in the metals industry for the Council on Wage and Price Stability in Washington, D.C. In 1999, Mr. Moeller received the award for most accurate forecast from the Forecasters' Club of New York. From 1990 to 1992 he was President of the New York Association for Business Economists. Mr. Moeller earned an M.B.A. in Finance from Fordham University, where he graduated in 1987. He holds a Bachelor of Arts in Economics from George Washington University.
More Economy in Brief


