 Global| Apr 08 2010
U.S. Consumer Credit Decline Reverses Earlier Gain
by:Tom Moeller
|in:Economy in Brief
Summary
Consumer borrowing continued its retrenchment during February. Consumer credit outstanding fell $11.5B, reversing a revised $10.6B January increase which was much larger than reported last month. The Federal Reserve reported late- [...]
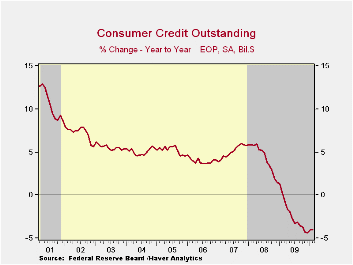
Consumer borrowing continued its retrenchment during February. Consumer credit outstanding fell $11.5B, reversing a revised $10.6B January increase which was much larger than reported last month. The Federal Reserve reported late-Wednesday that the resultant 4.0% y/y decline in credit outstanding remained near the record. During the last ten years, there has been a 60% correlation between the y/y change in credit outstanding and the change in personal consumption expenditures.
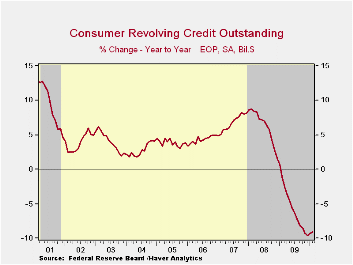
Usage of revolving credit was cut sharply. The $9.5B drop followed a modest January increase and left usage down a near-record 9.1% y/y. Versus February 2009, finance companies lowered lending by 14.3%, commercial bank lending fell 12.7%, pools of securitized assets fell 7.4%. Loans from credit unions offset some of these declines with a 6.5% increase while savings institution raised lending 1.6%.
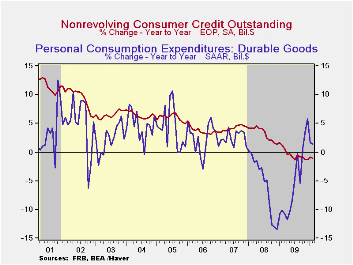
Increased usage of non-revolving credit (autos & other consumer durables), which accounts for nearly two-thirds of the total, fell a moderate $2.0B following a sharp $9.1B January gain. The 1.1% y/y decline is clearly modest relative to the cutback in revolving credit and it has been stable at that rate since the middle of last year. Federal government & Sallie Mae lending expanded by nearly three-quarters y/y during February. That increase offset a 14.5% decline in pools of securitized assets, a 13.7% fall in savings institutions, an 11.8% decline in finance companies, a 2.8% fall in credit union lending and a 0.1% downtick in commercial bank lending.
These figures are the major input to the Fed's quarterly Flow of Funds accounts for the household sector.
| Consumer Credit Outstanding (m/m Chg, SAAR) | February | January | December | Y/Y | 2009 | 2008 | 2007 |
|---|---|---|---|---|---|---|---|
| Total | $-11.5B | $10.6B | $-7.5B | -4.0% | -4.4% | 1.5% | 5.7% |
| Revolving | $-9.5B | $1.5B | $-9.4B | -9.1% | -9.6% | 1.6% | 8.1% |
| Non-revolving | $-2.0B | $9.1B | $1.9B | -1.1% | -1.3% | 1.5% | 4.4% |

Tom Moeller
AuthorMore in Author Profile »Prior to joining Haver Analytics in 2000, Mr. Moeller worked as the Economist at Chancellor Capital Management from 1985 to 1999. There, he developed comprehensive economic forecasts and interpreted economic data for equity and fixed income portfolio managers. Also at Chancellor, Mr. Moeller worked as an equity analyst and was responsible for researching and rating companies in the economically sensitive automobile and housing industries for investment in Chancellor’s equity portfolio. Prior to joining Chancellor, Mr. Moeller was an Economist at Citibank from 1979 to 1984. He also analyzed pricing behavior in the metals industry for the Council on Wage and Price Stability in Washington, D.C. In 1999, Mr. Moeller received the award for most accurate forecast from the Forecasters' Club of New York. From 1990 to 1992 he was President of the New York Association for Business Economists. Mr. Moeller earned an M.B.A. in Finance from Fordham University, where he graduated in 1987. He holds a Bachelor of Arts in Economics from George Washington University.
More Economy in Brief


