U.S. Consumer Confidence Slumps Again in December, Led by Expectations
by:Sandy Batten
|in:Economy in Brief
Summary
The Conference Board Consumer Confidence Index declined to 128.1 (+4.1% y/y) in December from a slightly upwardly revised 136.4 in November. This was the second consecutive monthly decline in the index. The panelists in the Action [...]
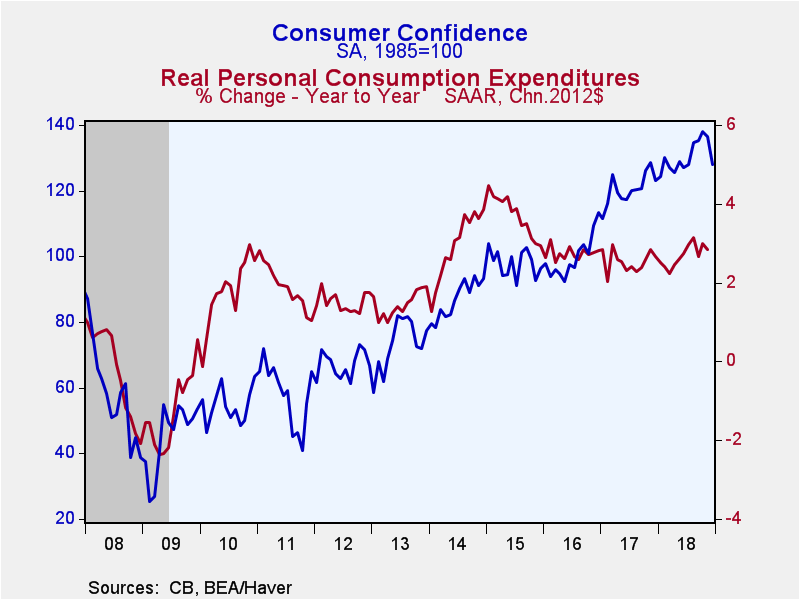
The Conference Board Consumer Confidence Index declined to 128.1 (+4.1% y/y) in December from a slightly upwardly revised 136.4 in November. This was the second consecutive monthly decline in the index. The panelists in the Action Economic Forecast Survey had expected a decline, but a smaller one--to 134.1. The indexes in the report are based on 1985=100. During the past 10 years, there has been a 69% correlation between the level of consumer confidence and the y/y change in monthly real PCE.
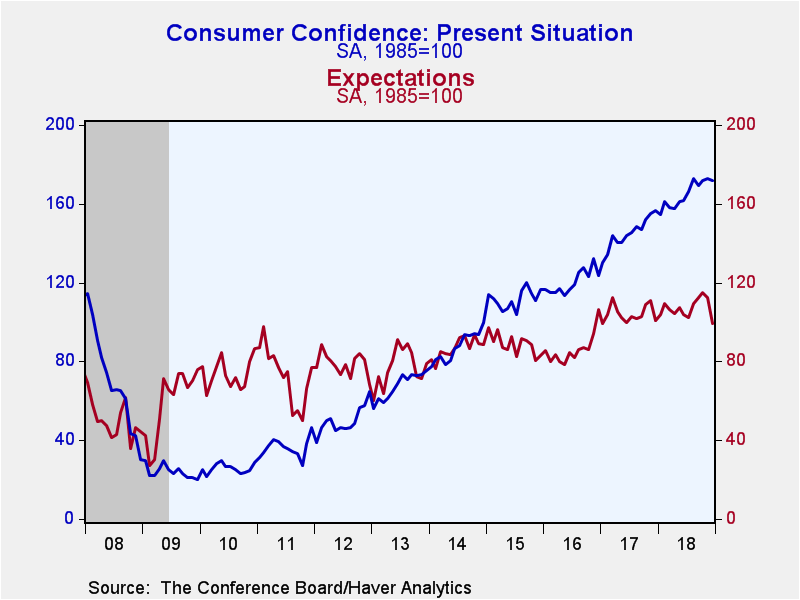
As was the November drop, the December decline was led by weaker expectations. The expectations index fell more than 13 points to 99.1 from 112.3 in November. This was the largest monthly decline since August 2011. Moreover, the expectations index is now 1.7% lower than it was a year ago. Apparently, the sharp drop in equity prices over the past several months, weaker economic growth reported abroad, and increased trade tensions with China have served to cool the outlook for the domestic economy. In contrast, the view of the present situation has not been much affected. The present situation index slipped only about 1 point in December to 171.6 and is essentially unchanged since October. It has risen 9.6% over the past year.
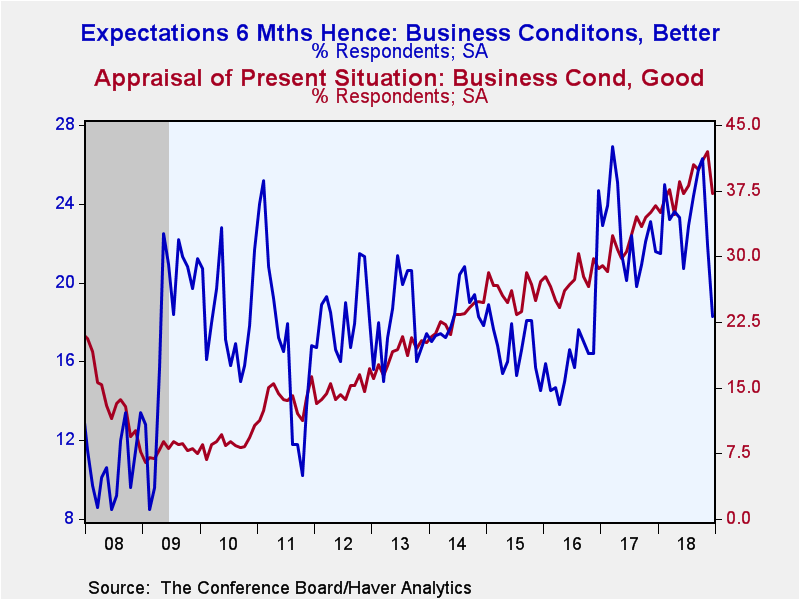
The view of business conditions slipped a bit in December. Business conditions were viewed as "good" by 37.2% of respondents, down from 42.0% in November, and viewed as "bad" by 11.3%, up from 10.7% in November. Respondents' view of the labor market continued to tighten. Jobs viewed as "plentiful" slipped slightly in December, to 46.2% from a 17-year high of 46.8% in November. But jobs were viewed as easier to get. Jobs were viewed as "hard to get" by 11.6% of respondents, down from 12.6% in November and the lowest since November 2000. As a result, the net jobs assessment reading, the difference between plentiful and hard to get, increased to 34.6, the highest since January 2001. Over the past 20 years, this differential has a -91% correlation with the unemployment rate.
Expectations for business conditions deteriorated further in December with 18.3% of respondents expecting conditions to improve over the next six months, down from 21.9% in November. In contrast, 9.7% of respondents expect business conditions to worsen over the next six months versus 8.3% in November. Also, respondents look for labor market conditions to ease over the next six months. The percentage of respondents expecting more jobs to emerge over the next six months fell to 16.6% from 22.7% in November while the percentage expecting fewer jobs rose to 14.4% from 11.2%.
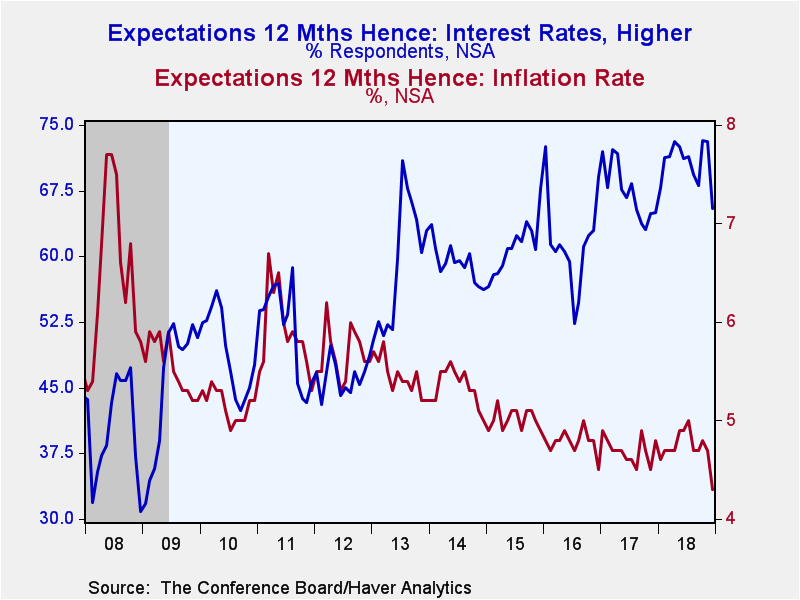
The inflation rate expected in twelve months fell for a second consecutive month. The percentage expecting higher interest rates over the next twelve months declined sharply, to 65.5% from 73.1% in November, the largest monthly decline since February 2016. Those looking to buy a home in the next six months fell to 6.0% from 6.4% in November, and that was down from the 7.4% high in late 2017.
Confidence among respondents under age 35-years-old fell to 132.5 in December from 143.2 in November, but the November reading was an 18-year high. For those aged 35-54, confidence edged up in December to 132.7 from 130.1 in November. Respondents over 55 years of age suffered the largest decline of confidence of the three major age groups. Confidence in this group slumped more than 18 points to 119.3, the largest monthly decline since the global financial crisis in 2008-09. It would appear that the sharp drop in equity prices since the end of September disproportionately impacted this age group.
The Consumer Confidence data are available in Haver's CBDB database. The total indexes appear in USECON, and the market expectations are in AS1REPNA.
| Conference Board (SA, 1985=100) | Dec | Nov | Oct | Dec Y/Y % | 2017 | 2016 | 2015 |
|---|---|---|---|---|---|---|---|
| Consumer Confidence Index | 128.1 | 136.4 | 137.9 | 4.1 | 120.5 | 99.8 | 98.0 |
| Present Situation | 171.6 | 172.7 | 171.9 | 9.6 | 144.8 | 120.3 | 111.7 |
| Expectations | 99.1 | 112.3 | 115.1 | -1.7 | 104.3 | 86.1 | 88.8 |
| Consumer Confidence By Age Group | |||||||
| Under 35 Years | 132.5 | 143.2 | 133.7 | 3.0 | 130.2 | 122.4 | 116.0 |
| Aged 35-54 Years | 132.7 | 130.1 | 143.2 | 5.1 | 123.5 | 106.2 | 103.9 |
| Over 55 Years | 119.3 | 137.6 | 134.9 | 2.4 | 112.9 | 84.6 | 84.1 |
Sandy Batten
AuthorMore in Author Profile »Sandy Batten has more than 30 years of experience analyzing industrial economies and financial markets and a wide range of experience across the financial services sector, government, and academia. Before joining Haver Analytics, Sandy was a Vice President and Senior Economist at Citibank; Senior Credit Market Analyst at CDC Investment Management, Managing Director at Bear Stearns, and Executive Director at JPMorgan. In 2008, Sandy was named the most accurate US forecaster by the National Association for Business Economics. He is a member of the New York Forecasters Club, NABE, and the American Economic Association. Prior to his time in the financial services sector, Sandy was a Research Officer at the Federal Reserve Bank of St. Louis, Senior Staff Economist on the President’s Council of Economic Advisors, Deputy Assistant Secretary for Economic Policy at the US Treasury, and Economist at the International Monetary Fund. Sandy has taught economics at St. Louis University, Denison University, and Muskingun College. He has published numerous peer-reviewed articles in a wide range of academic publications. He has a B.A. in economics from the University of Richmond and a M.A. and Ph.D. in economics from The Ohio State University.
More Economy in Brief
 Global| Feb 05 2026
Charts of the Week: Balanced Policy, Resilient Data and AI Narratives
by:Andrew Cates


