 Global| Sep 28 2007
U.S. Construction Spending Recovered A Bit
by:Tom Moeller
|in:Economy in Brief
Summary
The value of construction put in place recovered 0.2% last month following a 0.5% drop during July. The rise topped consensus expectations for another decline of 0.5%. Strength in public construction spending again provided much of [...]
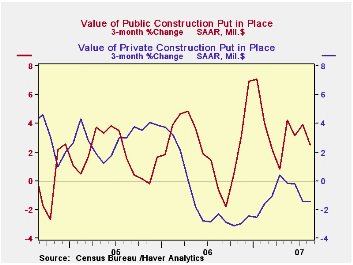
The value of construction put in place recovered 0.2% last month following a 0.5% drop during July. The rise topped consensus expectations for another decline of 0.5%.
Strength in public construction spending again provided much of the lift to overall construction spending with a 0.7% rise. Construction on highways & streets jumped 0.8% (4.2% y/y). The value of construction on highways and streets is nearly one third of the value of total public construction spending. Construction spending on education gave a real pop with a 1.3% (18.3% y/y) rise.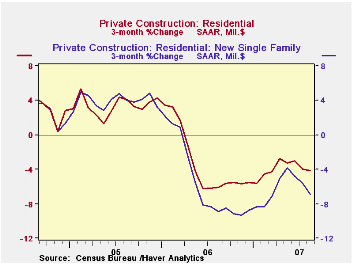
Nonresidential building jumped 2.3% after a slight dip in July. Office construction surged 3.7% (14.7% y/y) while construction in the commercial sector jumped 2.6% (14.2% y/y). It more than recovered its 1.3% July drop.
Residential building continued on the down slope and fell 1.4%. Building of new single family building fell another huge 3.3% (-25.6% y/y). Spending on improvements recovered from two months of decline with a 1.6% (1.3% y/y) increase.
During the last twenty years there has been an 84% correlation between the q/q change in the value of residential building and its contribution to growth in real GDP.
These more detailed categories represent the Census Bureau’s reclassification of construction activity into end-use groups. Finer detail is available for many of the categories; for instance, commercial construction is shown for Automotive sales and parking facilities, drugstores, building supply stores, and both commercial warehouses and mini-storage facilities. Note that start dates vary for some seasonally adjusted line items in 2000 and 2002 and that constant-dollar data are no longer computed.
Globalization, Macroeconomic Performance, and Monetary Policy is yesterday's speech by Federal Reserve Board GovernorFrederic S. Mishkin and it is available here.
| August | July | Y/Y | 2006 | 2005 | 2004 | |
|---|---|---|---|---|---|---|
| Total | 0.2% | -0.5% | -1.7% | 5.6% | 10.7% | 11.0% |
| Private | 0.0% | -1.1% | -6.1% | 4.7% | 12.0% | 13.8% |
| Residential | -1.5% | -1.7% | -16.5% | 0.5% | 13.7% | 18.7% |
| Nonresidential | 2.3% | -0.2% | 15.2% | 15.2% | 7.8% | 3.8% |
| Public | 0.7% | 1.2% | 14.7% | 9.2% | 6.2% | 1.7% |

Tom Moeller
AuthorMore in Author Profile »Prior to joining Haver Analytics in 2000, Mr. Moeller worked as the Economist at Chancellor Capital Management from 1985 to 1999. There, he developed comprehensive economic forecasts and interpreted economic data for equity and fixed income portfolio managers. Also at Chancellor, Mr. Moeller worked as an equity analyst and was responsible for researching and rating companies in the economically sensitive automobile and housing industries for investment in Chancellor’s equity portfolio. Prior to joining Chancellor, Mr. Moeller was an Economist at Citibank from 1979 to 1984. He also analyzed pricing behavior in the metals industry for the Council on Wage and Price Stability in Washington, D.C. In 1999, Mr. Moeller received the award for most accurate forecast from the Forecasters' Club of New York. From 1990 to 1992 he was President of the New York Association for Business Economists. Mr. Moeller earned an M.B.A. in Finance from Fordham University, where he graduated in 1987. He holds a Bachelor of Arts in Economics from George Washington University.
More Economy in Brief


