 Global| Mar 01 2010
U.S. Construction Activity Falls To Lowest Since 2003
by:Tom Moeller
|in:Economy in Brief
Summary
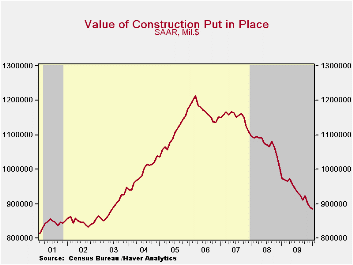
Construction activity continued to move lower in January to the lowest level since 2003. Construction outlays fell 0.6% following an unrevised 1.2% December decline but the November drop was doubled. The latest decline roughly equaled [...]
 Construction
activity continued to move lower in January to the lowest level since
2003. Construction outlays fell 0.6% following an unrevised 1.2%
December decline but the November drop was doubled. The latest decline
roughly equaled the Consensus estimate.
Construction
activity continued to move lower in January to the lowest level since
2003. Construction outlays fell 0.6% following an unrevised 1.2%
December decline but the November drop was doubled. The latest decline
roughly equaled the Consensus estimate.
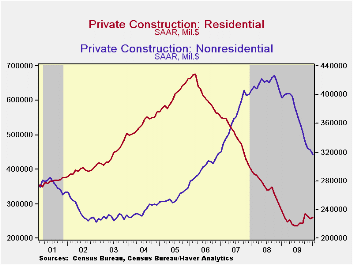
Although the level of total private construction activity continued lower in January, residential building activity increased for the first time in three months. All of the gain was, however, due to a 4.7% rise (10.6% y/y) in spending on home improvements. Single-family construction activity slipped 0.2% (-8.6% y/y) while multi-family building dropped a sharp 11.1% and was off one-half from the year ago level.
Nonresidential building activity fell another 2.1% during January and was off 19.9% during the last twelve months. Since the 2008 peak, activity has fallen by one-quarter. Spending on lodging fell 9.8% during January (-46.0% y/y) while office construction dropped 1.6% (-34.25 y/y). Health care construction fell a lesser 0.5% (-10.6% y/y) and educational building also slipped just 0.7% (-15.8% y/y).
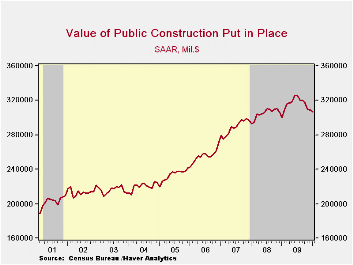
In the public sector, building activity slipped 0.7% as commercial building fell 9.6% (+9.9% y/y). Spending on highways & streets offset that decline with a 1.2% increase (5.5% y/y). Public spending on health care facilities fell a sharp 8.2% m/m but remained up modestly. Building in the education sector was unchanged for the month and down 6.2% from last January.
The construction put-in-place figures are available in Haver's USECON database.
| Construction Put In Place (%) | January | December | November | Y/Y | 2009 | 2008 | 2007 |
|---|---|---|---|---|---|---|---|
| Total | -0.6 | -1.2 | -2.5 | -9.3 | -12.4 | -6.9 | -1.6 |
| Private | -0.6 | -1.7 | -2.6 | -14.3 | -18.7 | -11.1 | -5.7 |
| Residential | 1.3 | -2.8 | -2.5 | -6.4 | -27.9 | -29.1 | -19.7 |
| Nonresidential | -2.1 | -0.7 | -2.7 | -19.9 | -10.9 | 13.2 | 23.1 |
| Public | -0.7 | -0.4 | -2.2 | 2.1 | 3.6 | 5.6 | 13.1 |

Tom Moeller
AuthorMore in Author Profile »Prior to joining Haver Analytics in 2000, Mr. Moeller worked as the Economist at Chancellor Capital Management from 1985 to 1999. There, he developed comprehensive economic forecasts and interpreted economic data for equity and fixed income portfolio managers. Also at Chancellor, Mr. Moeller worked as an equity analyst and was responsible for researching and rating companies in the economically sensitive automobile and housing industries for investment in Chancellor’s equity portfolio. Prior to joining Chancellor, Mr. Moeller was an Economist at Citibank from 1979 to 1984. He also analyzed pricing behavior in the metals industry for the Council on Wage and Price Stability in Washington, D.C. In 1999, Mr. Moeller received the award for most accurate forecast from the Forecasters' Club of New York. From 1990 to 1992 he was President of the New York Association for Business Economists. Mr. Moeller earned an M.B.A. in Finance from Fordham University, where he graduated in 1987. He holds a Bachelor of Arts in Economics from George Washington University.
More Economy in Brief


