 Global| Nov 20 2008
U.S. Claims For Jobless Insurance Highest Since 1992
by:Tom Moeller
|in:Economy in Brief
Summary
Rising unemployment caused initial claims for jobless insurance to rise further above 500,000. At 542,000 claims reached their highest level since 1992. But even that comparison, as bad as it is, understates the current degree of [...]
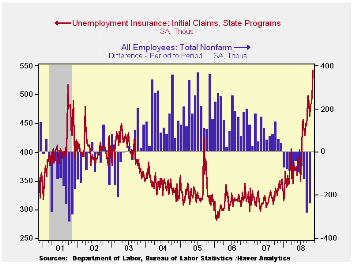
Rising unemployment caused initial claims for jobless insurance to rise further above 500,000. At 542,000 claims reached their highest level since 1992. But even that comparison, as bad as it is, understates the current degree of labor market weakness. The 1992 level above 500,00 was reached for only one week during the short-lived, early-1990's recession. Quickly claims fell back below 400,000. The higher level of claims now is especially troubling since it likely will be sustained for a longer period.
The higher level of claims now is especially disturbing for two reasons. One is that it likely will be sustained for a longer period than one week. The second is that changes to the unemployment insurance program have made it more difficult to be eligible for a claim. Even a lower level of claims now is comparable to a weaker labor market.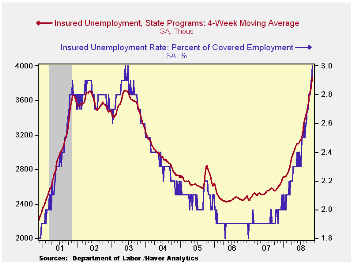
Expectations had been for claims last week of 500,000. The four-week moving average of initial claims rose to this cycle's high of 506,500 (52.7% y/y).
The latest level of initial claims for unemployment insurance is for the week which covers the survey period for November nonfarm payrolls. Claims rose 63,000, or 13.2%, from the October period. During the last ten years there has been a 78% (inverse) correlation between the level of initial jobless insurance claims and the monthly change in nonfarm payrolls.
The largest increases in initial claims for the week ending Nov. 8 were in California (+15,532), North Carolina (+6,453), Tennessee (+5,067), New Jersey (+4,706), and New York (+3,680), while the largest decreases were in Kentucky (-1,562), Puerto Rico (-875), Delaware (-751), Maine (-349), and Rhode Island (-335).
Continuing claims for unemployment insurance during the week of November 8 rose by 109,000, about the same as during the prior week during which the level was upwardly revised. The four-week average of continuing claims rose to 3,867,000, this cycle's high and the highest since 1982. Continuing claims provide some indication of workers' ability to find employment and they lag the initial claims figures by one week.
The insured rate of unemployment rose to a new cycle high of 3.0%. The Commerce Department indicated that the highest insured unemployment rates were in Puerto Rico (5.3 percent), Oregon (3.9), California (3.7), Nevada (3.7), Michigan (3.5), Alaska (3.4), Pennsylvania (3.4), South Carolina (3.4), New Jersey (3.3), Arkansas (3.2), and North Carolina (3.2).
The minutes to the latest FOMC meeting can be found here.
| Unemployment Insurance (000s) | 11/15/08 | 11/08/08 | 10/31/08 | Y/Y | 2007 | 2006 | 2005 |
|---|---|---|---|---|---|---|---|
| Initial Claims | 542 | 515 | 484 | 62.8% | 322 | 313 | 331 |
| Continuing Claims | -- | 4,012 | 3,903 | 55.5% | 2,552 | 2,459 | 2,662 |
by Tom Moeller November 20, 2008
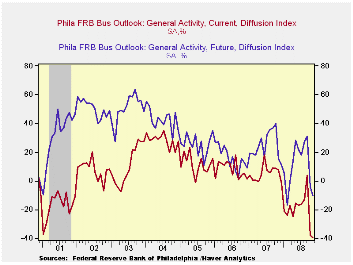
The latest report from the Philadelphia Federal Reserve Bank continued to paint a bleak picture of the U.S. economy. The bank reported that its November Index of General Business conditions in the manufacturing sector was even more negative at -39.3 than it was last month at -37.5. The latest was lowest level since the recession of 1990. A reading of -35 had been expected for this month.
During the last ten years there has been a 61% correlation between the level of the Philadelphia Fed Business Conditions Index and the three-month growth in factory sector industrial production. There has been a 43% correlation with q/q growth in real GDP.
The Philadelphia Fed constructs a diffusion index for total business activity and each of the sub-indexes. The business conditions index reflects a separate survey question.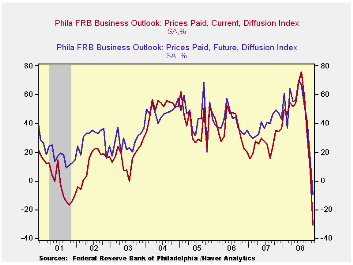
Amongst the sub-indexes, the new orders index again led this month's weakness with a reading of -31.4, the lowest level since the recession of 1990. The shipments index was unchanged m/m following its 21.4 point October decline.
The employment index fell another 7.2 points to the lowest level since the recession year of 2001. Thirty eight percent of respondents expected to reduce employment levels, the highest since 1981, while only 12.6% expected to raise them. During the last ten years there has been a 79% correlation between the index level and the m/m change in manufacturing sector payrolls.
The prices paid index fell to a record low with a 37.9 point drop month-to-month to 30.7. During the last ten years there has been a 67% correlation between the prices paid index and the three-month growth in the intermediate goods PPI. There has been an 82% correlation with the change in core intermediate goods prices.
The separate index of expected business conditions in six months also fell further to near its lowest level since 2001. The expectations index for new orders fell further into negative territory. The expectations index for employment fell to near its record low while the expected prices paid figure fell to its record low.
The latest Business Outlook Survey from the Federal Reserve Bank of Philadelphia can be found here.
| Philadelphia Fed (%) | November | October | November '07 | 2007 | 2006 | 2005 |
|---|---|---|---|---|---|---|
| General Activity Index | -39.3 | -37.5 | 7.5 | 5.1 | 8.1 | 11.5 |
| Prices Paid Index | -30.7 | 7.2 | 34.4 | 26.4 | 36.6 | 40.1 |
by Tom Moeller November 20, 2008
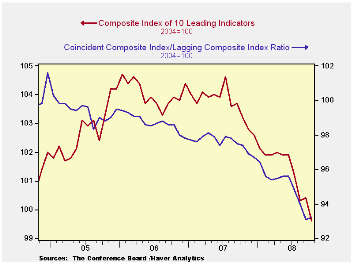
The Conference Board indicated that the October composite index of leading economic indicators fell by 0.8% after rising a downwardly revised 0.1% during September. The peak for the index was in July of last year and the six-month percent change fell to -4.7%, the largest rate of decline in nearly one year.
Six of the ten components of the leading index fell last month notably consumer expectations, vendor performance, stock prices and building permits.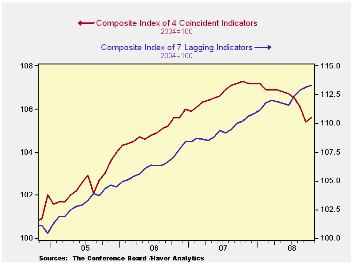
The breadth of one-month increase amongst the leaders' 10 components fell back to 35% and over a six-month period the breadth of gain amongst the components picked slightly to 30%.
The leading index is based on actual reports for eight economic data series. The Conference Board initially estimates two series, orders for consumer goods and orders for capital goods.
The coincident indicators rose 0.2% following five consecutive months of decline. Three quarters of the index components rose m/m but over six months none rose. Over the last ten years there has been an 86% correlation between the y/y changes in the coincident indicators and real GDP.
The lagging index ticked up 0.1%, the smallest increase in four months. The ratio of coincident to lagging indicators (a measure of economic excess) also ticked up slightly but remained near its lowest level since 1982.Visit the Conference Board's site for coverage of leading indicator series from around the world.
| Business Cycle Indicators (%) | October | September | August | July, 6 Month % (AR) | 2007 | 2006 | 2005 |
|---|---|---|---|---|---|---|---|
| Leading | -0.8 | 0.1 | -0.9 | -4.7 | -0.4% | 1.3% | 2.7% |
| Coincident | 0.2 | -0.7 | -0.4 | -2.4 | 1.7% | 2.4% | 2.5% |
| Lagging | 0.1 | 0.3 | 0.4 | 2.5 | 2.9% | 3.1% | 3.1% |
by Robert Brusca November 20, 2008
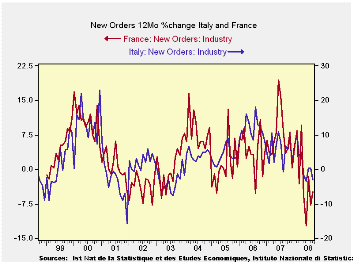
For France and Italy new industrial orders continue to sink. France is right now seeing the greater weakness. Foreign orders show consistent weakness across time horizons for both Italy and for France. For France the recent deterioration in foreign orders is a bit worse than for Italy. But one remaining difference between these two countries is that in Italy domestic orders have shown some resiliency. Over three six and twelve months Italian orders have mostly showed increases. Meanwhile for France total and foreign order are down by almost the same percentage amounts over three months, hinting at weakening domestic orders. Italy may just be a step behind however. While Italy’s domestic orders have been resilient, in September they have dropped by a sharp 2.6%. Also Italy’s overall sales trends are deteriorating very rapidly. Both Italy and France seem to be well on their way to a deepening weakness in manufacturing.
| Saar exept m/m | Sep-08 | Aug-08 | Jul-08 | 3-mo | 6-mo | 12-mo |
| Total | -1.5% | -0.9% | 2.2% | -1.0% | -5.1% | -3.0% |
| Foreign | 0.8% | -3.4% | -0.8% | -13.1% | -11.6% | -11.4% |
| Domestic | -2.6% | 0.3% | 3.8% | 5.7% | -1.4% | 1.9% |
| Memo | ||||||
| Sales | 1.7% | -3.1% | -2.6% | -15.1% | -1.6% | -0.6% |
| French Orders | ||||||
| Saar exept m/m | Sep-08 | Aug-08 | Jul-08 | 3-mo | 6-mo | 12-mo |
| Total | 0.7% | -7.6% | 4.7% | -10.1% | -3.0% | -4.9% |
| Foreign | 2.2% | -8.3% | 3.4% | -11.9% | -7.2% | -8.5% |

Tom Moeller
AuthorMore in Author Profile »Prior to joining Haver Analytics in 2000, Mr. Moeller worked as the Economist at Chancellor Capital Management from 1985 to 1999. There, he developed comprehensive economic forecasts and interpreted economic data for equity and fixed income portfolio managers. Also at Chancellor, Mr. Moeller worked as an equity analyst and was responsible for researching and rating companies in the economically sensitive automobile and housing industries for investment in Chancellor’s equity portfolio. Prior to joining Chancellor, Mr. Moeller was an Economist at Citibank from 1979 to 1984. He also analyzed pricing behavior in the metals industry for the Council on Wage and Price Stability in Washington, D.C. In 1999, Mr. Moeller received the award for most accurate forecast from the Forecasters' Club of New York. From 1990 to 1992 he was President of the New York Association for Business Economists. Mr. Moeller earned an M.B.A. in Finance from Fordham University, where he graduated in 1987. He holds a Bachelor of Arts in Economics from George Washington University.
More Economy in Brief


