 Global| Feb 13 2014
U.S. Business Inventories Rise Last Quarter Led by Retail
by:Tom Moeller
|in:Economy in Brief
Summary
Total business inventories increased 0.5% in December (4.0% y/y) after a 0.4% November gain. Though the rate of inventory accumulation slowed late in the quarter, the entire quarter's gain of 1.7% was the swiftest since Q3 2013. This [...]
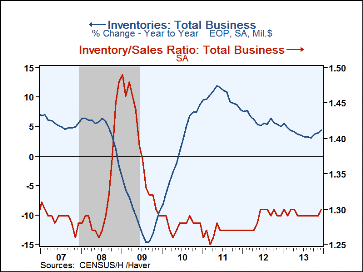
Total business inventories increased 0.5% in December (4.0% y/y) after a 0.4% November gain. Though the rate of inventory accumulation slowed late in the quarter, the entire quarter's gain of 1.7% was the swiftest since Q3 2013. This inventory rise accompanied a slim 0.1% gain (3.8% y/y) in business sales after November's 0.7% increase. As a result, the inventory-to-sales ratio rose to 1.30, up from the steady 1.29 of the prior seven months.
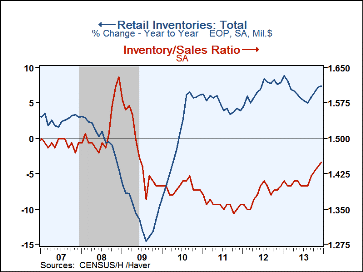
In the retail sector, inventories advanced 0.6% (7.3% y/y) in December. The 2.6% rise during the quarter was the swiftest since Q3 2010. Motor vehicle inventories led the December gain with a 1.3% rise (14.3% y/y) and were up 5.7% in Q4, the quickest gain since Q2 2010. Inventories excluding autos rose 0.2% (4.2% y/y) and the Q/Q rise was firm at 1.1%. Inventories of furniture, electronics and appliances rose 0.5% (-0.5% y/y) and the quarterly gain of 1.6% was the strongest since Q2 2010. It raised the I/S ratio to its highest level since February. Clothing inventories also rose a firm 1.0% (2.9% y/y) in December and the 1.4% quarterly rise was the swiftest since Q2 2012. The I/S ratio remained, however, low. General merchandise stores' inventories appear to be under greater control. The 0.1% dip (+4.4% y/y) in December left the quarterly rise at a modest 0.5% though the I/S ratio still remained up from a year ago.
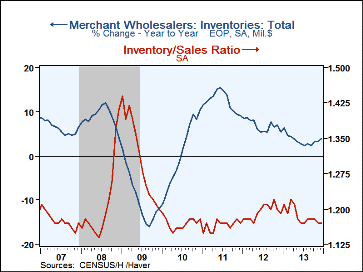
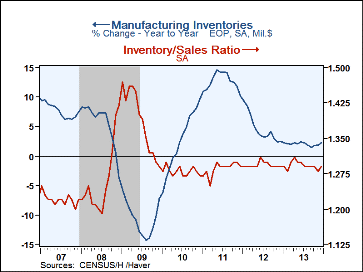
Overall, it looks like merchant wholesale inventories kept their inventories under control. The 0.3% rise (4.0% y/y) in inventories left the I/S ratio at 1.17, its lowest level since November 2010. Nondurable goods distributors inventories fell 1.3% (+1.3% y/y), led lower by a 5.1% drop (-11.5% y/y) in petroleum. Inventories excluding petroleum, however, fell a lesser 0.8%, and were up 3.1% y/y. Durable wholesale inventories gained 1.3% (5.7% y/y). That left the I/S ratio at a roughly stable 1.58. Factory sector inventories increased 0.5% (2.3% y/y) but the I/S ratio held at a low 1.29.
Business sales lost forward momentum in December and ticked up just 0.1% (3.8% y/y). For the quarter, however, sales rose a firm 1.3%, constant with the Q3 rise. Retail sales were roughly unchanged (3.7% y/y) in December. Wholesale sales improved 0.5% and by a steady 5.8% y/y. Shipments from the factory sector fell 0.2% in December (+2.1% y/y).
The manufacturing and trade data are in Haver's USECON database.
| Business Inventories (%) | Dec | Nov | Oct | Dec Y/Y | 2013 | 2012 | 2011 |
|---|---|---|---|---|---|---|---|
| Total | 0.5 | 0.4 | 0.8 | 4.4 | 4.4 | 5.1 | 7.9 |
| Retail | 0.6 | 0.8 | 1.1 | 7.3 | 7.3 | 8.0 | 3.9 |
| Retail excl. Motor Vehicles | 0.2 | 0.6 | 0.3 | 4.2 | 4.2 | 3.2 | 3.6 |
| Merchant Wholesalers | 0.3 | 0.5 | 1.3 | 4.0 | 4.0 | 5.5 | 9.2 |
| Manufacturing | 0.5 | 0.1 | 0.0 | 2.3 | 2.3 | 2.4 | 10.2 |
| Business Sales (%) | |||||||
| Total | 0.1 | 0.7 | 0.5 | 3.8 | 3.4 | 4.4 | 11.0 |
| Retail | -0.0 | 0.2 | 0.4 | 2.6 | 4.3 | 5.1 | 7.7 |
| Retail excl. Motor Vehicles | 0.3 | -0.2 | 0.4 | 3.0 | 3.3 | 4.8 | 7.0 |
| Merchant Wholesalers | 0.5 | 1.0 | 1.1 | 5.8 | 4.3 | 4.3 | 12.8 |
| Manufacturing | -0.2 | 0.8 | 0.1 | 2.1 | 2.1 | 4.0 | 12.1 |
| I/S Ratio | |||||||
| Total | 1.30 | 1.29 | 1.29 | 1.29 | 1.29 | 1.29 | 1.27 |
| Retail | 1.45 | 1.44 | 1.43 | 1.40 | 1.41 | 1.38 | 1.36 |
| Retail Excl. Motor Vehicles | 1.23 | 1.23 | 1.22 | 1.21 | 1.22 | 1.21 | 1.23 |
| Merchant Wholesalers | 1.17 | 1.17 | 1.18 | 1.19 | 1.19 | 1.19 | 1.17 |
| Manufacturing | 1.29 | 1.28 | 1.29 | 1.29 | 1.29 | 1.29 | 1.29 |
Tom Moeller
AuthorMore in Author Profile »Prior to joining Haver Analytics in 2000, Mr. Moeller worked as the Economist at Chancellor Capital Management from 1985 to 1999. There, he developed comprehensive economic forecasts and interpreted economic data for equity and fixed income portfolio managers. Also at Chancellor, Mr. Moeller worked as an equity analyst and was responsible for researching and rating companies in the economically sensitive automobile and housing industries for investment in Chancellor’s equity portfolio. Prior to joining Chancellor, Mr. Moeller was an Economist at Citibank from 1979 to 1984. He also analyzed pricing behavior in the metals industry for the Council on Wage and Price Stability in Washington, D.C. In 1999, Mr. Moeller received the award for most accurate forecast from the Forecasters' Club of New York. From 1990 to 1992 he was President of the New York Association for Business Economists. Mr. Moeller earned an M.B.A. in Finance from Fordham University, where he graduated in 1987. He holds a Bachelor of Arts in Economics from George Washington University.


