 Global| Apr 12 2016
U.S. Budget Deficit Doubles
by:Tom Moeller
|in:Economy in Brief
Summary
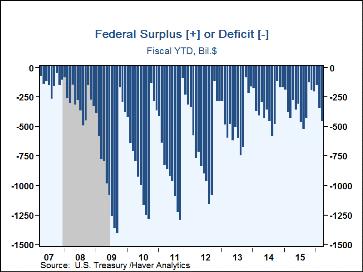
The U.S. Treasury Department reported a $108.0 billion budget deficit during March of 2016, roughly double the size of the $52.9 billion deficit twelve months earlier. A $94.0 billion deficit had been expected in the Action Economics [...]
The U.S. Treasury Department reported a $108.0 billion budget deficit during March of 2016, roughly double the size of the $52.9 billion deficit twelve months earlier. A $94.0 billion deficit had been expected in the Action Economics Forecast Survey. During the first six months of FY'16 the deficit totaled $461.0 billion, up 4.9% versus the first six months of FY'15.
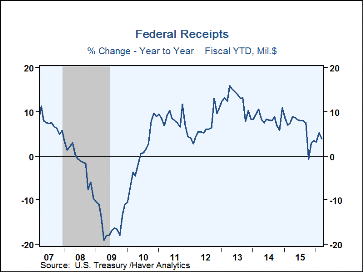
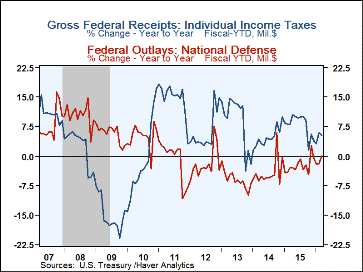
Overall revenues increased 4.0% so far in FY'16 versus the first six months of FY'15. The gain was pulled lower by a 7.7% y/y fall in corporate income tax payments, compared to 7.2% growth last year. Individual income taxes grew a diminished 5.2% y/y. Social insurance contributions increased 2.8% y/y while excise taxes edged 0.4% lower y/y.
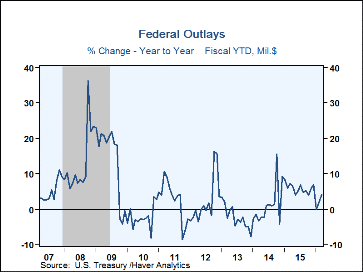
Government spending increased 4.2% y/y so far in FY'16. Outlays on health programs gained 7.9% y/y with the Patient Protection and Affordable Care Act. Veterans Benefits & Services rose 6.1% y/y. Medicare payments increased 4.4% y/y while spending on Education, Training, Employment & Social Services similarly gained 4.4% y/y. Social Security benefits rose 3.6% y/y, but National Defense Spending edged just 0.1% higher y/y. Income security payments eased 0.1% y/y with the lower unemployment rate. Interest payments increased 18.2% y/y.
Haver's data on Federal Government outlays and receipts are contained in USECON. Considerable detail is given in the separate GOVFIN database. The Action Economics Forecast Survey numbers are in the AS1REPNA database.
| United States Government Finance | March 2016 | FY'15 | FY'14 | FY'13 | FY'12 | |
|---|---|---|---|---|---|---|
| Budget Balance | -- | -$108.0 bil. | -$438.9 bil. | -$483.4 bil. | -$680.2 bil. | -$1,089.2 bil. |
| As a percent of GDP | -- | -- | 2.5 | 2.8 | 4.1 | 6.8 |
| % of Total | ||||||
| Net Revenues (Fiscal YTD, Y/Y % Change) | 100 | 4.0% | 7.6% | 8.9% | 13.3% | 6.4% |
| Individual Income Taxes | 47 | 5.2 | 10.5 | 5.9 | 16.3 | 3.7 |
| Corporate Income Taxes | 11 | -7.7 | 7.2 | 17.3 | 12.9 | 33.8 |
| Social Insurance Taxes | 33 | 2.8 | 4.1 | 8.0 | 12.1 | 3.2 |
| Excise Taxes | 3 | -0.4 | 5.3 | 11.1 | 6.3 | 9.2 |
| Net Outlays (Fiscal YTD, Y/Y % Change) | 100 | 4.2 | 5.2 | 1.4 | -2.4 | -1.7 |
| National Defense | 16 | 0.1 | -2.3 | -4.7 | -6.3 | -3.9 |
| Health | 13 | 7.9 | 17.8 | 14.3 | 3.3 | -7.0 |
| Medicare | 15 | 4.4 | 6.7 | 2.8 | 5.5 | -2.8 |
| Income Security | 14 | -0.1 | -0.9 | -4.3 | -1.1 | -9.1 |
| Social Security | 24 | 3.6 | 4.4 | 4.5 | 5.2 | 5.8 |
| Veterans Benefits & Services | 4 | 6.1 | 6.8 | 7.7 | 11.5 | -2.0 |
| Education, Training, Employment & Social Services | 3 | 4.4 | 34.7 | 25.9 | -21.9 | -10.3 |
| Interest | 6 | 18.2 | -1.8 | 2.8 | 0.4 | -3.0 |
Tom Moeller
AuthorMore in Author Profile »Prior to joining Haver Analytics in 2000, Mr. Moeller worked as the Economist at Chancellor Capital Management from 1985 to 1999. There, he developed comprehensive economic forecasts and interpreted economic data for equity and fixed income portfolio managers. Also at Chancellor, Mr. Moeller worked as an equity analyst and was responsible for researching and rating companies in the economically sensitive automobile and housing industries for investment in Chancellor’s equity portfolio. Prior to joining Chancellor, Mr. Moeller was an Economist at Citibank from 1979 to 1984. He also analyzed pricing behavior in the metals industry for the Council on Wage and Price Stability in Washington, D.C. In 1999, Mr. Moeller received the award for most accurate forecast from the Forecasters' Club of New York. From 1990 to 1992 he was President of the New York Association for Business Economists. Mr. Moeller earned an M.B.A. in Finance from Fordham University, where he graduated in 1987. He holds a Bachelor of Arts in Economics from George Washington University.


