 Global| Oct 30 2008
U.S. 3Q'08 GDP Fell Modestly
by:Tom Moeller
|in:Economy in Brief
Summary
U.S. real GDP fell a modest 0.3% (AR) last quarter after 2.8% growth during 2Q. Consensus expectations had been for a decline at a 0.5% rate. The decline last quarter mirrored a 0.2% decline during the fourth quarter of last year. The [...]
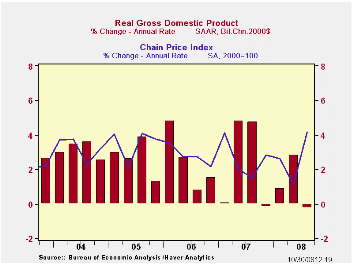
U.S. real GDP fell a modest 0.3% (AR) last quarter after 2.8% growth during 2Q. Consensus expectations had been for a decline at a 0.5% rate. The decline last quarter mirrored a 0.2% decline during the fourth quarter of last year. The y/y rate of growth of 0.8% was the weakest since the end of the 2001 recession.
Real final sales to domestic purchasers
were notably weak in
3Q as they posted a 1.8% (AR) decline. That was the largest quarterly
decline since the end of the 1990-91 recession. The year-to-year dip of
0.1%, while modest, was the first since 1991.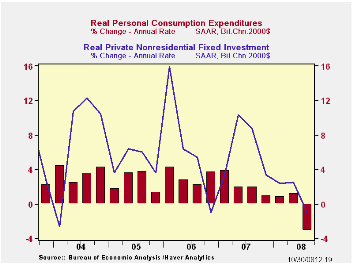
Real personal consumption declined at a 3.1% (0.0% y/y) annual rate, reversing a 1.2% rise during 2Q. The 2Q gain presumably was fueled by tax rebate checks but the lift seems to have been slight. Spending on autos & light trucks fell at a 25.6% (-14.7% y/y) annual rate after declining at a 19.7% rate during 2Q. Spending on furniture & other household equipment fell at a 7.6% rate (+2.7% y/y) and the decline reversed roughly half of the 2Q increase. Spending on apparel fell at an 11.0% rate (-0.4% y/y) and that reversed all of the 2Q jump. Spending on consumer services also weakened to a 0.6% growth rate. That about matched the 2Q rise but the y/y change of 1.3% was the weakest since 1981. Growth in real PCE subtracted 2.3 percentage points from 3Q real GDP growth after a 0.9 point add during 2Q.
Residential construction fell again, last quarter at a 19.1% (-21.3% y/y) annual rate after a 13.3% rate of decline during 2Q. The 3Q drop subtracted 0.7 percentage points from GDP growth.
Growth in business fixed investment fell
for the first time
since fourth quarter, 2006. The 1.0% decline (+1.8% y/y) followed 2.5%
growth during 2Q, a 4.9% rise during 2007 and roughly 7.5% growth in
2006 and 2005. Equipment investment repeated its 2Q performance and
declined at a 5.5% rate (-2.6% y/y). Conversely, structures investment
was firm again and rose at a 7.9% annual rate (10.8% y/y).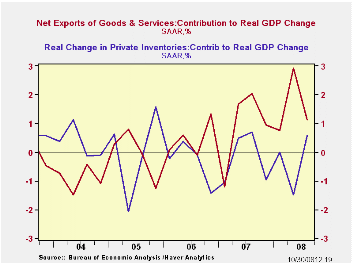
An improved foreign trade deficit again was the main source of lift to GDP growth, though the 1.1 percentage point addition was almost a third of that in 2Q. Exports grew at a slower 5.9% rate (6.9% y/y), half that in 2Q. Growth in imports weakened with the slowdown in overall economic growth. They fell at a 1.9% rate (-3.1% y/y).
Inventory accumulation added 0.6 percentage points to GDP growth after three consecutive quarters of subtraction.
Spending by governments was strong again and the 5.8% (3.1% y/y) rise was the quickest since early 2003.
The GDP chain price index surged at a 4.2% annual rate. The accelerated rate of increase owed to a 5.4% jump in the PCE price index which was fueled by higher energy prices. Capital spending prices rose at an accelerated 4.2% rate (2.2% y/y) while the residential investment price deflator declined for the fourth straight quarter (-1.8% y/y).
Fed, Central Banks in Brazil, Mexico, Korea and Singapore, Announce Swap Lines and the Fed's announcement can be found here.
| Chained 2000$, % AR | 3Q '08 (Advance) | 2Q '08 | 3Q Y/Y | 2007 | 2006 | 2005 |
|---|---|---|---|---|---|---|
| GDP | -0.3 | 2.8 | 0.8 | 2.0 | 2.8 | 2.9 |
| Inventory Effect | 0.6 | -1.5 | -0.4 | -0.4 | 0.0 | -0.2 |
| Final Sales | -0.8 | 4.4 | 1.3 | 2.4 | 2.8 | 3.1 |
| Foreign Trade Effect | 1.1 | 2.9 | 1.7 | 0.6 | 0.2 | 0.0 |
| Domestic Final Demand | -1.8 | 1.3 | -0.1 | 1.8 | 2.6 | 3.1 |
| Chained GDP Price Index | 4.2 | 1.1 | 2.7 | 2.7 | 3.2 | 3.3 |
by Tom Moeller October 30, 2008
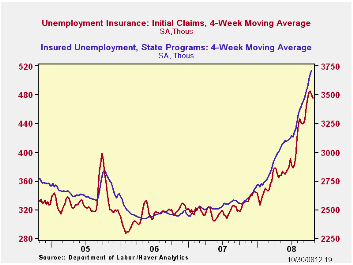
Initial claims for jobless insurance were stable last week at 479,000, near the high for this cycle. The figure was about as expected. The four-week moving average of initial claims fell slightly to 475,500 (44.2% y/y), still just off the cycle high.
The largest increases in initial claims for the week ending Oct. 18 were in Tennessee (+1,956), Oregon (+1,802), Indiana (+1,297), Virginia (+898), and Florida (+543), while the largest decreases were in New York (-6,080), Michigan (-5,894), Illinois (-3,795), Ohio (-2,923), and Kentucky (-2,494).
Continuing claims for unemployment insurance during the week
of
October 18 fell 12,000 after a revised 7,000 increase during the prior
week, initially reported as a slight decline. The four-week average of
continuing claims rose further to this cycle's high of 3,709,500, the
highest level since early 2003. Continuing claims provide some
indication of workers' ability to find employment and they lag the
initial claims figures by one week.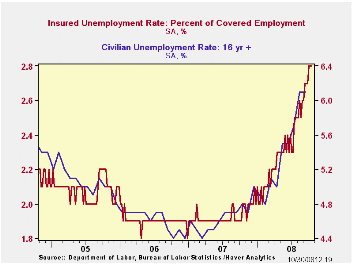
The insured rate of unemployment was stable for the third week at 2.8%. That was this cycle's high and the highest since mid-2003. The high in that recessionary period was 3.0% reached in late June 2003.
What Exactly Is a Recession—and Are We in One? from the Federal Reserve Bank of Cleveland can be found here.
| Unemployment Insurance (000s) | 10/25/08 | 10/18/08 | 10/11/08 | Y/Y | 2007 | 2006 | 2005 |
|---|---|---|---|---|---|---|---|
| Initial Claims | 478 | 479 | 463 | 44.3% | 322 | 313 | 331 |
| Continuing Claims | -- | 3,715 | 3,727 | 43.0 | 2,552 | 2,459 | 2,662 |
by Robert Brusca October 30, 2008
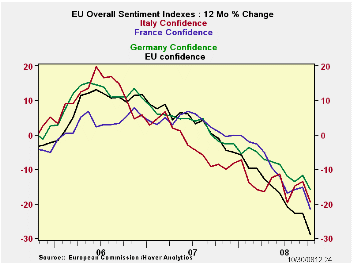
The news this month for the EU/EMU region is bad. The EU reading is in the bottom 10% of its range of value. The EMU reading is a bit better, in the bottom 17% of its range. Both are quite weak. The drop in the index is the largest since the data have been collected in 1991. All sectors made larger falls in Oct compared to Sept. The main EMU countries also saw large drops in their respective overall sentiment indices.
By sector, services is relatively the hardest hit standing at
the
lowest point of its range since that survey began. But that only goes
back to October of 1996 instead of 1991 as for the other surveys. Still
this result parallels the sort of readings we have been getting in the
US with a very weak service sector checking in.
Is
this more than coincidence? You bet! This crisis is hitting
intrinsically domestic sectors harder like real estate and finance.
Typically banks populate every community; the same with real estate
businesses. These sectors are not like mining or autos or textiles that
may have a particular regional representation. The troubled sectors in
this cycle are spread everywhere and the troubled asset class ‘housing’
is everywhere, as well. It’s as true in Europe as in the US.INDUSTRY
Europe’s industry reading at -18 (EMU) is only in the 32nd percentile of its range (bottom third of its range) and so is weak but not desperately weak. Germany and France carry percentile positions for their respective readings in the high thirty percentiles while Spain’s is at the 33rd percentile and the UK is at the 27Th percentile; Italy is looking desperate at the 17Th percentile. These are weak readings but the most troubling for Italy.
The components of the industry index show that the production trend is the weakest relative reading standing in the bottom 3% of its historic range. Production expectations are better but still weak in their 12th percentile. For some reason Europeans think that a worse time lies behind it not ahead of it. That explains a lot about the government attitudes. Europe has been in and seem to remain in DENIAL. Order volumes are still relatively firm in their 44th range percentile; export orders are in about the same relative range position and that is also where the expected selling price resides. Contrarily workers are more exposed with employment expectations in the bottom 16 percentile of their range. If worker readings are RIGHT then the rest of the readings are too high.CONFIDENCE
By main countries confidence readings are all over the map except that they are limited being to all over intrinsically weak territory. The EU’s UK reading is in the bottom 2.9% of its all-time range. Among large EMU nations Spain is weakest posting the lowest confidence reading ever. It is followed by France with a bottom 5 percentile reading. Germany’s percentile reading at the 43% mark and is similar to its industrial sector reading but at 37.5 Italy’s percentile reading is way above its industry percentile. So, Italian consumer confidence is more upbeat than it is for Italian industry.
As for the reason for this angst, ee find over all EMU responses on ‘time to buy’ are at the very worst for making major purchases now or in the next 12 months. The economic situation in the past 12-months is rated as the worst ever but looking ahead for the next 12-months the out look is ‘only’ a bottom 13% ordeal. Respondents may want to rethink that one. The financial situation for this past and this next 12-months each rate in their respective 12th percentile. In short the readings really are weak. Unemployment expectations are ‘only up to the 58th percentile of their range – elevated, but not by much.RETAIL
The retail readings across EU countries are weakest in the UK, residing in their bottom 3 range percentile followed by Spain (bottom 13%), Germany (bottom 26%), France (bottom 43%), and Italy (63rd percentile – still above its range midpoint). Retailers are not as downbeat as consumers and that could spell some troubles for them and for their inventories. Retail orders are put in the bottom 14% of their range. The expected business situation is only a bottom 38% rating similar to the present business situation. And maybe the retailers are just putting up a brave front since their orders are so weak. They may be planning for something even weaker than what they say they expect… SERVICES
Service sector reading span the gamut form bad to worst. The UK and Italy have the worst service sector readings ever. Spain’s reading is in the bottom 6% of its range. German is a bottom 25% reading; for France the reading is a bottom one-third of range reading. All of theses are weak. For EMU the overall reading is the worst ever. The business climate is a bottom 7% affair, but expected demand is worse in the bottom 2% of its range. Current demand is rated as in only the 16th percentile. Current and expected employment readings are in the 20th percentile of their respective ranges, and the reading is lower for expected unemployment. Things will get worse. Maybe industry workers are better protected by unions that service sector workers.CONSTRUCTION
The construction sector is the least impacted off all. For overall sentiment, construction stands in the 49th percentile of its range. Of course that implies a raw reading of -20. One issue for construction it that its participants have considered it sub-par all along. So now the outlook is being impacted construction respondents are not looking for things to get that much worse. Spain is an exception having had a boom its current reading; it is a bottom 19th percentile reading. For the UK the residential property bubble busting has helped to drag its reading to the 31st percentile. France and Germany still carry mid range readings at or above their expected range midpoints. Italy’s sector has a relatively strong construction reading in the 60th percentile.
| EU Sectors and Country level Overall Sentiment | |||||||||||
|---|---|---|---|---|---|---|---|---|---|---|---|
| EU | Oct 08 |
Sep 08 |
Aug 08 |
Jul 08 |
%tile | Rank | Max | Min | Range | Mean | R-SQ w/Overall |
| Overall | 77.5 | 84.9 | 86.7 | 88.8 | 9.8 | 209 | 116 | 73 | 43 | 99 | 1.00 |
| Industrial | -19 | -13 | -10 | -7 | 23.5 | 204 | 7 | -27 | 34 | -7 | 0.86 |
| Consumer Confidence | -23 | -19 | -19 | -20 | 13.8 | 205 | 2 | -27 | 29 | -11 | 0.83 |
| Retail | -16 | -13 | -14 | -11 | 18.5 | 214 | 6 | -21 | 27 | -6 | 0.51 |
| Construction | -25 | -20 | -18 | -17 | 37.8 | 150 | 3 | -42 | 45 | -17 | 0.41 |
| Services | -10 | -4 | -2 | 0 | 0.0 | 145 | 32 | -10 | 42 | 16 | 0.81 |
| % m/m |
Oct 08 |
Based on Level | Level | ||||||||
| EMU | -8.1% | -1.1% | -1.1% | 80.4 | 16.8 | 206 | 117 | 73 | 44 | 99 | 0.94 |
| Germany | -5.1% | -1.4% | -2.7% | 88.6 | 23.5 | 186 | 121 | 79 | 42 | 99 | 0.61 |
| France | -7.0% | -0.6% | -0.1% | 86.5 | 31.6 | 196 | 119 | 72 | 47 | 100 | 0.79 |
| Italy | -6.9% | 0.6% | 2.7% | 82.1 | 21.6 | 206 | 121 | 71 | 50 | 99 | 0.78 |
| Spain | -5.0% | -2.0% | -4.3% | 66.1 | 0.0 | 220 | 118 | 66 | 52 | 99 | 0.62 |
| Memo: UK | -7.5% | -5.2% | -6.1% | 70.4 | 3.4 | 219 | 118 | 69 | 50 | 100 | 0.42 |
| Since 1990 except Services (Oct 1996) 247-Count; Services: 145-Count | |||||||||||
| Sentiment is an index, sector readings are net balance diffusion measures. | |||||||||||

Tom Moeller
AuthorMore in Author Profile »Prior to joining Haver Analytics in 2000, Mr. Moeller worked as the Economist at Chancellor Capital Management from 1985 to 1999. There, he developed comprehensive economic forecasts and interpreted economic data for equity and fixed income portfolio managers. Also at Chancellor, Mr. Moeller worked as an equity analyst and was responsible for researching and rating companies in the economically sensitive automobile and housing industries for investment in Chancellor’s equity portfolio. Prior to joining Chancellor, Mr. Moeller was an Economist at Citibank from 1979 to 1984. He also analyzed pricing behavior in the metals industry for the Council on Wage and Price Stability in Washington, D.C. In 1999, Mr. Moeller received the award for most accurate forecast from the Forecasters' Club of New York. From 1990 to 1992 he was President of the New York Association for Business Economists. Mr. Moeller earned an M.B.A. in Finance from Fordham University, where he graduated in 1987. He holds a Bachelor of Arts in Economics from George Washington University.
More Economy in Brief


