 Global| Aug 25 2004
Surge In Aircraft Lifts U.S. Durable Goods Orders
by:Tom Moeller
|in:Economy in Brief
Summary
A 37.2% m/m surge in orders for aircraft raised durable goods orders in July by 1.7% versus Consensus expectations for a 1.0% rise. Less aircraft durable orders fell 0.5% (+8.3% y/y), the third m/m decline in the last four. The rise [...]
A 37.2% m/m surge in orders for aircraft raised durable goods orders in July by 1.7% versus Consensus expectations for a 1.0% rise. Less aircraft durable orders fell 0.5% (+8.3% y/y), the third m/m decline in the last four.
The rise in new aircraft orders was powered by a doubling of orders for commercial aircraft that offset a one-third drop in defense aircraft bookings.
Higher aircraft orders raised the nondefense capital goods total by 9.0%, but less aircraft capital goods orders rose just 0.6% (11.0% y/y).
Orders for computers & electronic products fell 3.8% (+2.0% y/y), the third m/m decline in the last four. Computer orders fell 6.7% (-0.6% y/y) though a 5.0% rise in electrical equipment, appliance & component orders recouped half of the prior two months' decline. Machinery orders added 2.1% (18.0% y/y) to a 1.1% rise in June.
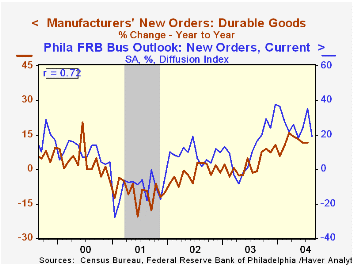
During the last ten years there has been a 58% correlation between the y/y change in durable goods orders and the orders component of the Philadelphia Federal Reserve's Business Outlook Survey. That correlation rose to 72% during the last five years.
Shipments of durable goods rose 0.1% (8.3% y/y) after a 1.1% June gain. Shipments excluding the transportation sector rose 1.7% (+12.6% y/y) after a 1.2% spurt in June.
Durable inventories rose 0.8% (3.4% y/y) for the third straight month.
New research from the Federal Reserve Bank of New York titled "The Relationship between Manufacturing Production and Goods Output" is available here.
| NAICS Classification | July | June | Y/Y | 2003 | 2002 | 2001 |
|---|---|---|---|---|---|---|
| Durable Goods Orders | 1.7% | 1.1% | 11.7% | 2.6% | -1.7% | -10.5% |
| Non-defense Capital Goods | 9.0% | 1.1% | 19.4% | 5.6% | -7.2% | -15.5% |
by Tom Moeller August 25, 2004

Sales of new one-family homes fell a sharp 6.4% in July to 1.134M, the lowest level since last December. Sales in June were revised down sharply to 1.211M from the initial report of 1.326M. Consensus estimates had been for sales of 1.300M.
Sales fell hard in the Northeast by 23.5% (-19.5% y/y) and in the South by 15.9% (-5.9% y/y). In the West sales slipped 1.7% (-4.0% y/y) for the third decline in the last four months. Sales in the Midwest rose a solid 21.5% (17.1% y/y).
The median price of a new single family home fell 2.6% to $207,400 (9.0% y/y), 5.6% below the February peak of $219,600.
During testimony before the Senate Banking Committee, Fed Chairman Greenspan indicated in response to a question about soaring house prices, "This observation raises the possibility that real estate prices, at least in some markets, could be out of alignment with the fundamentals." The complete Monetary Report to Congress is available here.
| Homes Sales (000s, AR) | July | June | Y/Y | 2003 | 2002 | 2001 |
|---|---|---|---|---|---|---|
| New Single-Family | 1,134 | 1,211 | -1.9% | 1,089 | 976 | 907 |
by Tom Moeller August 25, 2004

The index of mortgage applications compiled by the Mortgage Bankers Association fell 6.3% last week but during the prior period applications were up 11.9% due to a surge in refinancings.
Purchase applications fell 5.0% last week and so far this month are 2.4% below July.
During the last ten years there has been a 59% correlation between the y/y change in purchase applications and the change in new plus existing home sales.
Applications to refinance mortgages slipped 8.0% following the prior week's surge. Refi's so far in August are 9.0% ahead of July which rose 17.3% versus June.
The effective interest rate on a conventional 30-Year mortgage was stable at 6.05%, the average for August so far. That is down from 6.24% averaged last month and the high of 6.53% in May. The effective rate on a 15-year mortgage also was about stable at 5.47% versus 5.69% last month.
The Mortgage Bankers Association surveys between 20 to 35 of the top lenders in the U.S. housing industry to derive its refinance, purchase and market indexes. The weekly survey accounts for more than 40% of all applications processed each week by mortgage lenders. Visit the Mortgage Bankers Association site here.
| MBA Mortgage Applications (3/16/90=100) | 08/20/04 | 08/13/04 | Y/Y | 2003 | 2002 | 2001 |
|---|---|---|---|---|---|---|
| Total Market Index | 646.3 | 689.4 | 1.2% | 1,067.9 | 799.7 | 625.6 |
| Purchase | 443.7 | 467.1 | 18.2% | 395.1 | 354.7 | 304.9 |
| Refinancing | 1,824.9 | 1,982.7 | -15.9% | 4,981.8 | 3,388.0 | 2,491.0 |

Tom Moeller
AuthorMore in Author Profile »Prior to joining Haver Analytics in 2000, Mr. Moeller worked as the Economist at Chancellor Capital Management from 1985 to 1999. There, he developed comprehensive economic forecasts and interpreted economic data for equity and fixed income portfolio managers. Also at Chancellor, Mr. Moeller worked as an equity analyst and was responsible for researching and rating companies in the economically sensitive automobile and housing industries for investment in Chancellor’s equity portfolio. Prior to joining Chancellor, Mr. Moeller was an Economist at Citibank from 1979 to 1984. He also analyzed pricing behavior in the metals industry for the Council on Wage and Price Stability in Washington, D.C. In 1999, Mr. Moeller received the award for most accurate forecast from the Forecasters' Club of New York. From 1990 to 1992 he was President of the New York Association for Business Economists. Mr. Moeller earned an M.B.A. in Finance from Fordham University, where he graduated in 1987. He holds a Bachelor of Arts in Economics from George Washington University.
More Economy in Brief


