 Global| Oct 14 2005
Record Gain in Energy Prices Lifted CPI; Core Prices Tame
by:Tom Moeller
|in:Economy in Brief
Summary
The consumer price index (CPI-U) was a bit stronger than Consensus expectations for a 0.9% rise last month. The 1.2% gain was the strongest for any month since 1980 and lifted the y/y increase to its strongest (4.7%) since 1991. [...]
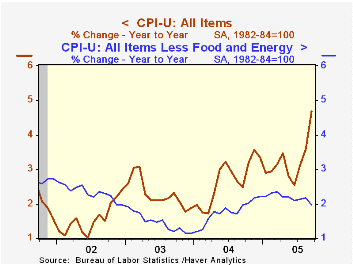
The consumer price index (CPI-U) was a bit stronger than Consensus expectations for a 0.9% rise last month. The 1.2% gain was the strongest for any month since 1980 and lifted the y/y increase to its strongest (4.7%) since 1991.
Higher energy prices continued to fuel the m/m increase and rose 12.0%, an all-time record. The 17.9% m/m rise in gasoline prices to an average $2.90 per gallon also was a record advance but prices have fallen slightly in October. Fuel oil prices also were strong, up 11.8% (46.0% y/y), while natural gas & electricity prices jumped 4.6% (13.5% y/y).
Prices less food & energy rose the same 0.1% as during the prior four months and again the gain was less than Consensus expectations for a 0.2% increase. Core goods prices rose 0.1% for the second consecutive month. Apparel prices fell 0.1% (-0.7% y/y) and most household furnishings prices fell as well. New vehicle prices rose 0.4% (0.7% y/y) and tobacco prices rose 0.7% (5.6% y/y).
Core services prices rose 0.1% for the second consecutive month as shelter prices fell 0.1% (+2.0% y/y) offset by a 0.3% (4.4% y/y) gain in medical care services prices. Public transportation prices rose 0.1% (7.5% y/y) for the second month and school tuition costs jumped 0.7% (6.3% y/y).
The chained CPI which adjusts for shifts in the mix of consumer purchases rose 0.8% and less food & energy chain prices rose 0.2%.
Update on the U.S. Economy and Fiscal Outlook, a speech made yesterday by Federal Reserve Board Governor Mark W. Olson, is available here.
| Consumer Price Index | Sept | Aug | Y/Y | 2004 | 2003 | 2002 |
|---|---|---|---|---|---|---|
| Total | 1.2% | 0.5% | 4.7% | 2.7% | 2.3% | 1.6% |
| Total less Food & Energy | 0.1% | 0.1% | 2.0% | 1.8% | 1.5% | 2.3% |
| Goods less Food & Energy | 0.1% | 0.1% | 0.6% | -0.9% | -2.0% | -1.1% |
| Services less Energy | 0.1% | 0.1% | 2.5% | 2.8% | 2.9% | 3.8% |
| Energy | 12.0% | 5.0% | 35.1% | 10.9% | 12.2% | -5.9% |
| Food | 0.3% | 0.0% | 2.5% | 3.4% | 2.1% | 1.8% |
| Chained CPI: Total (NSA) | 0.8% | 0.4% | 3.5% | 2.3% | 2.0% | 1.3% |
| Total less Food & Energy | 0.2% | 0.2% | 1.8% | 1.5% | 1.1% | 1.9% |

Tom Moeller
AuthorMore in Author Profile »Prior to joining Haver Analytics in 2000, Mr. Moeller worked as the Economist at Chancellor Capital Management from 1985 to 1999. There, he developed comprehensive economic forecasts and interpreted economic data for equity and fixed income portfolio managers. Also at Chancellor, Mr. Moeller worked as an equity analyst and was responsible for researching and rating companies in the economically sensitive automobile and housing industries for investment in Chancellor’s equity portfolio. Prior to joining Chancellor, Mr. Moeller was an Economist at Citibank from 1979 to 1984. He also analyzed pricing behavior in the metals industry for the Council on Wage and Price Stability in Washington, D.C. In 1999, Mr. Moeller received the award for most accurate forecast from the Forecasters' Club of New York. From 1990 to 1992 he was President of the New York Association for Business Economists. Mr. Moeller earned an M.B.A. in Finance from Fordham University, where he graduated in 1987. He holds a Bachelor of Arts in Economics from George Washington University.
More Economy in Brief


