 Global| Oct 12 2006
Record August U.S. Trade Deficit Swelled By Higher Oil Prices
by:Tom Moeller
|in:Economy in Brief
Summary
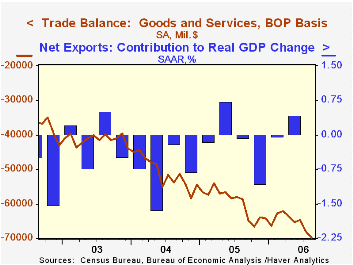
The U.S. foreign trade deficit surged to another record in August of $69.9B versus an unrevised $68.0B in July. The figure was materially deeper than Consensus expectations for a shallower deficit of $66.8B. A rise in the per barrel [...]

The U.S. foreign trade deficit surged to another record in August of $69.9B versus an unrevised $68.0B in July. The figure was materially deeper than Consensus expectations for a shallower deficit of $66.8B.
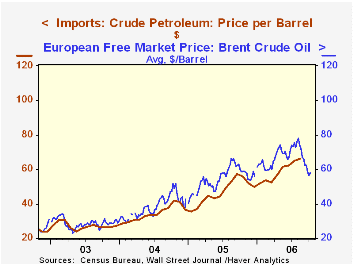
A rise in the per barrel cost of imported crude oil to $66.12 (+25.1% y/y) in August ran counter to the forty cent m/m decline in the price of Brent Crude to $73.40. Brent crude then fell eleven dollars per barrel in September and the price of oil in October is down another five dollars to $57 per bbl. The rise in oil prices lifted the value of energy-related petroleum products by 7.2% m/m (29.6% y/y). The quantity of petroleum product imports rose 6.3% m/m (4.0% y/y).
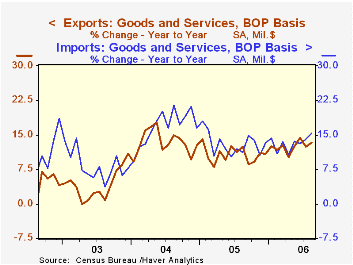
Overall imports of goods & services jumped 2.4% m/m during August, however, the rise in petroleum imports wasn't the only source of strength. Imports of nonpetroleum products rose 2.7% (13.4% y/y) as imports of capital goods increased 2.7% (14.2% y/y) and nonauto consumer goods imports rose 1.8% (12.4% y/y). Automotive imports also posted a firm 2.5% (5.7% y/y) gain while imports of foods, feeds & beverages jumped another 3.4% (12.9% y/y).
Total exports rose 2.3% in August and recovered a little revised 1.3% July drop. The turnaround came as capital goods exports jumped 3.8% (12.4% y/y), led by an 11.0% (-0.7% y/y) surge in commercial aircraft and a 12.3% (18.0% y/y) jump in computer exports. Exports of telecommunications equipment rose 4.3% (17.3% y/y) and exports of nonauto consumer goods surged another 2.2% (15.8% y/y).
Service exports inched up just 0.5% (8.4% y/y) as travel exports fell 1.1% (+5.1% y/y) and passenger fares also fell 1.8% (-2.5% y/y). These declines were offset by a 3.8% (19.8% y/y) gain in other transportation services. Imports of services fell for the second consecutive month. The 0.2% (+9.9% y/y) decline owed to a 2.0% (+5.4% y/y) drop in travel and a 2.3% (+5.7% y/y) decline in passenger fares.
The U.S. trade deficit in goods with China deteriorated to a record $22.0B in August ($201.5B in 2005) as exports fell 5.9% (+22.5% y/y) and imports rose 8.5% (19.2% y/y). With the newly industrialized Asian countries, the balance of goods trade improved slightly m/m to a deficit of $1.6B (-$15.8B in 2005) as exports surged 9.0% (6.9% y/y) and imports rose 4.8% (11.3% y/y).
Minutes to the September 20th meeting of the Federal Open Market Committee are available here.
| Foreign Trade | August | July | Y/Y | 2005 | 2004 | 2003 |
|---|---|---|---|---|---|---|
| U.S. Trade Deficit | $69.9B | $68.0B | $58.7B (8/05) |
$716.7B | $611.3B | $494.9B |
| Exports - Goods & Services | 2.3% | -1.3% | 13.4% | 10.7% | 13.4% | 4.2% |
| Imports - Goods & Services | 2.4% | 0.9% | 15.3% | 13.0% | 16.7% | 8.3% |
by Tom Moeller October 12, 2006

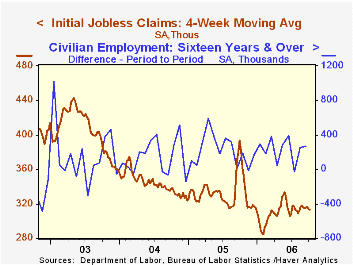
Initial claims for jobless insurance last week recovered just 4,000 of the revised 15,000 drop during the prior period and rose to 308,000. Consensus expectations had been for 311,000 claims.
During the last ten years there has been a (negative) 78% correlation between the level of initial claims and the m/m change in nonfarm payroll employment.
The four-week moving average of initial claims fell to 313,250 (-18.0% y/y).
Continuing claims for unemployment insurance rose 5,000 after a revised 7,000 increase the prior week that initially was reported as a modest w/w decline.
The insured rate of unemployment was steady at 1.9% where it has been since February.
The self-employment duration of younger men over the business cycle from the Federal Reserve Bank of Chicago is available here.
| Unemployment Insurance (000s) | 10/07/06 | 9/30/06 | Y/Y | 2005 | 2004 | 2003 |
|---|---|---|---|---|---|---|
| Initial Claims | 308 | 304 | -17.2% | 332 | 343 | 403 |
| Continuing Claims | -- | 2,445 | -13.5% | 2,662 | 2,924 | 3,532 |
by Carol Stone October 12, 2006

Besides the US, China reported its latest trade data today, these for September. In the month, the Chinese trade surplus was $15.3 billion, off from August's record $18.8 billion. The September balance is still the second largest monthly surplus ever. Exports rose $900 million to $91.6 billion, and imports surged $4.4 billion to $76.3 billion. Both the export and import amounts are records.
On September 25th here, Louise Curley called our attention to the size of China's exports and indicated they were in the process of surpassing those of the US. Indeed, this has come to pass; despite an upward revision to the US exports for July from $79.2 billion to $80.1 billion, China's exports of $80.3 billion are still larger and the margin in August widened as China shipped out $90.8 billion of merchandise and the US, $89.3 billion (all data not seasonally adjusted).
Two other points in the Chinese data stand out. China's imports expanded rapidly this summer. Commodity details for September are not yet available, but in August, a wide variety of machinery, metals and other products showed gains. China, like many industrial countries, is a net importer of petroleum, so its August fuel purchases also rose. It's easy to forget, when we express concern about China's trade, that it's two-way. Imports are expanding as their business activity grows.
Secondly, with the same-day release of US trade data, our attention was caught by the fact that the US reports much bigger imports from China than China reports exports to the US. The difference in August is some $7.5 billion, or about 40%, clearly more than some timing convention or shipping charge. Perhaps you already know the answer, and Haver database managers have investigated this before. But to teach me and refresh your memory, we checked on it again. The reason is that China's goods frequently transit some other Asian trading center, especially Hong Kong. Materials and parts may be processed further or finished goods may simply pass through the ports. Handlers there may tack on a "mark-up". But China only counts the value of the goods as they leave China; Chinese shippers may not even know the ultimate destination of their products, only the customer they are selling to directly. In contrast, the US counts imports from their original origin (redundancy intentional here), not simply the last place they were transferred before entering the US. Thus, about half the difference in the Chinese and US figures is accounted for in Hong Kong's re-exports to the US, shown in the table below, which the US tallies as imports from China. 
The "definitive" explanation is provided in a Census Bureau press release, now more than 10 years old, of a joint study by the Census Bureau and China's Ministry of Foreign Trade and China's Customs bureau. It is available here. In recent years, the proportionate size of the difference has diminished somewhat, perhaps due to a larger share of direct shipping to the US and also more specific reporting by Chinese exporters of the ultimate buyers of their goods. Data on Chinese trade are contained in Haver's premium CHINA database compiled by CEIC and also in EMERGEPR, our own in-house collection of country-sourced information covering several Pacific Rim nations.
| China: NSA, Mil.US$ | Sept 2006 | Aug 2006 | July 2006 | Sept 2005 | Monthly Averages|||
|---|---|---|---|---|---|---|---|
| 2005 | 2004 | 2003 | |||||
| Trade Balance | 15,298 | 18,796 | 14,615 | 7,577 | 8,500 | 2,675 | 2,122 |
| Exports | 91,640 | 90,766 | 80,327 | 70,148 | 63,496 | 49,444 | 36,519 |
| Imports | 76,342 | 71,970 | 65,712 | 62,571 | 54,996 | 46,769 | 34,397 |
| Exports to US | 19,531 | 19,160 | 17,172 | 15,537 | 13,578 | 10,414 | 7,709 |
| Hong Kong Re- Exports to US | -- | 4,007 | 4,131 | 4,027 | 3,462 | 3,243 | 3,056 |
| Total | -- | 23,167 | 21,303 | 19,564 | 17,040 | 13,657 | 10,765 |
| US Imports from China | -- | 26,723 | 24,640 | 23,295 | 20,289 | 16,390 | 12,703 |
| US Exports, Total | -- | 89,324 | 80,132 | 74,381 | 75,498 | 68,231 | 60,398 |
Tom Moeller
AuthorMore in Author Profile »Prior to joining Haver Analytics in 2000, Mr. Moeller worked as the Economist at Chancellor Capital Management from 1985 to 1999. There, he developed comprehensive economic forecasts and interpreted economic data for equity and fixed income portfolio managers. Also at Chancellor, Mr. Moeller worked as an equity analyst and was responsible for researching and rating companies in the economically sensitive automobile and housing industries for investment in Chancellor’s equity portfolio. Prior to joining Chancellor, Mr. Moeller was an Economist at Citibank from 1979 to 1984. He also analyzed pricing behavior in the metals industry for the Council on Wage and Price Stability in Washington, D.C. In 1999, Mr. Moeller received the award for most accurate forecast from the Forecasters' Club of New York. From 1990 to 1992 he was President of the New York Association for Business Economists. Mr. Moeller earned an M.B.A. in Finance from Fordham University, where he graduated in 1987. He holds a Bachelor of Arts in Economics from George Washington University.
More Economy in Brief
 Global| Feb 05 2026
Charts of the Week: Balanced Policy, Resilient Data and AI Narratives
by:Andrew Cates


