 Global| Mar 06 2007
Q4 Productivity Revised Down; Bonus Payments Boost Unit Labor Cost
Summary
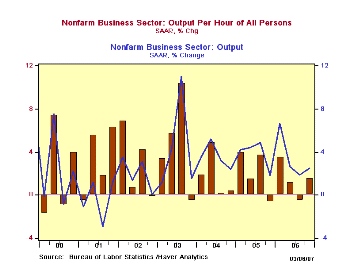
Nonfarm labor productivity was revised to 1.6% in Q4 from 3.0% reported a month ago. The revision was in line with market forecasts, which were based on the most recent revision to GDP. For 2006 as a whole, productivity was also up [...]
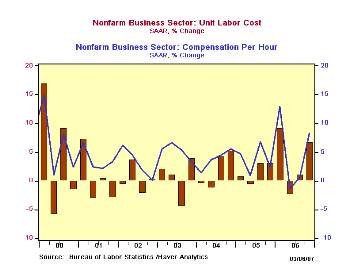 Compensation per hour last quarter was lifted substantially, reflecting unusually large bonuses paid by companies in Q4. Originally seen at 4.8%, that figure is now at 8.2%. However, Q3 was revised downward to just 0.6% from 3.1%, so the year as a whole was lowered to 4.8% from 5.3% reported last month.
Unit labor cost growth rose commensurately in Q4 with the upward revision to compensation and the downward shift in productivity. It is now reported at 6.6% from 1.7% before. Forecast expectations had it at about 3.0% but at least some forecasters projected as much as 6.5%, factoring in all of the changes in output and compensation. Interestingly, though, these various changes all offset each other over the course of 2005 and 2006, so that unit labor costs for those years as a whole were unchanged from the initial 2.0% and 3.2% estimates.
Compensation per hour last quarter was lifted substantially, reflecting unusually large bonuses paid by companies in Q4. Originally seen at 4.8%, that figure is now at 8.2%. However, Q3 was revised downward to just 0.6% from 3.1%, so the year as a whole was lowered to 4.8% from 5.3% reported last month.
Unit labor cost growth rose commensurately in Q4 with the upward revision to compensation and the downward shift in productivity. It is now reported at 6.6% from 1.7% before. Forecast expectations had it at about 3.0% but at least some forecasters projected as much as 6.5%, factoring in all of the changes in output and compensation. Interestingly, though, these various changes all offset each other over the course of 2005 and 2006, so that unit labor costs for those years as a whole were unchanged from the initial 2.0% and 3.2% estimates.
Factory sector productivity growth was unchanged in Q4 from the 2.2% gain shown earlier. The yearly figure was pushed up slightly, however, from 3.9% to 4.0%. Compensation in manufacturing had already shown a sizable Q4 increase of 7.3% and it was actually reduced a bit to 7.1%. For the year, it rose 3.8%, compared with 4.1% reported before. Unit labor costs were still firm in Q4, 4.7%, revised from 5.0%. The sharp reduction in Q3 compensation lowered annual unit labor costs in manufacturing to an outright decline of 0.2% from a 0.2% increase reported last month.
| Non-farm Business Sector (SAAR) | 4Q '06 (Rev) | 4Q '06 (Old) | 3Q '06 (Rev) | Y/Y (Rev) | 2006 (Rev) | 2005 (Rev) | 2004 (Rev) |
|---|---|---|---|---|---|---|---|
| Output per Hour | 1.6% | 3.0% | -0.5% | 1.4% | 1.6% | 2.1% | 2.9% |
| Compensation per Hour | 8.2% | 4.8% | 0.6% | 4.9% | 4.8% | 4.1% | 3.6% |
| Unit Labor Costs | 6.6% | 1.7% | 1.1% | 3.4% | 3.2% | 2.0% | 0.7% |
by Louise Curley March 6, 2007
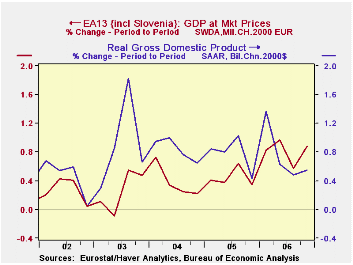
Gross Domestic Product in the Euro Area rose 0.89% in the fourth quarter or at an annual rate of 3.59%. These numbers compare with 0.55% and 2.22% for the United States. Although the growth for the whole year was greater in the U.S. than in the Euro Area (3.3% vs 2.6%), growth in the latter was greater than the former in the last three quarters of the year as can be seen in the first chart.
The European Commission is forecasting a range of GDP growth for the Euro Area for the first three quarters of 2007. The high estimates of growth in GDP are 0.8%, 0.9% and 0.9% in the first, second and third quarters. The low estimates are 0.4%, 0.5% and 0.3% respectively. The ranges are shown in the second chart. In 2006, as shown in the table below, the actual period to period changes in the Euro Area's seasonally adjusted GDP exceeded the upper value of the range in the first, third and fourth quarters of 2006.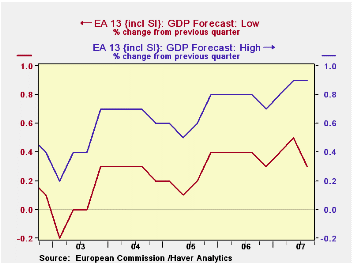
The Commission's forecast is based on a factor model--a largely mechanical technique that condenses a large data set of some 2000 time series for the Euro-area countries into a small number of "factors". The model uses these "factors" to make projections of euro-area GDP. The model is not equipped to take into account such one time events as the VAT increase in Germany in January 2007. As a result, the normal confidence level attached to the reported forecast ranges of 68%, which corresponds to +/- one standard deviation of past forecast errors, may fail to reflect the added uncertainty in the outlook relating to the first quarter's imposition of the German VAT increase.
| DOMESTIC PRODUCT GROWTH RATES | Q4 06 | 3Q 06 | Q2 06 | Q1 06 | 2006 | 2005 | 2004 |
|---|---|---|---|---|---|---|---|
| (SA Period to period % Chg) | |||||||
| Euro Area Actual | 0.89 | 0.57 | 0.97 | 0.82 | 2.64 | 1.38 | 2.01 |
| Euro Area Forecast Low | 0.3 | 0.4 | 0.4 | 0.4 | -- | -- | -- |
| Euro Area Forecast High | 0.8 | 0.8 | 0.8 | 0.7 | -- | -- | -- |
| United States | 0.55 | 0.49 | 0.63 | 1.37 | 3.30 | 3.22 | 3.91 |
Carol Stone, CBE
AuthorMore in Author Profile »Carol Stone, CBE came to Haver Analytics in 2003 following more than 35 years as a financial market economist at major Wall Street financial institutions, most especially Merrill Lynch and Nomura Securities. She had broad experience in analysis and forecasting of flow-of-funds accounts, the federal budget and Federal Reserve operations. At Nomura Securities, among other duties, she developed various indicator forecasting tools and edited a daily global publication produced in London and New York for readers in Tokyo. At Haver Analytics, Carol was a member of the Research Department, aiding database managers with research and documentation efforts, as well as posting commentary on select economic reports. In addition, she conducted Ways-of-the-World, a blog on economic issues for an Episcopal-Church-affiliated website, The Geranium Farm. During her career, Carol served as an officer of the Money Marketeers and the Downtown Economists Club. She had a PhD from NYU's Stern School of Business. She lived in Brooklyn, New York, and had a weekend home on Long Island.
More Economy in Brief


