 Global| Oct 17 2006
PPI Fell, Core Prices Firm
by:Tom Moeller
|in:Economy in Brief
Summary
The overall producer price index dropped 1.3% last month and by far exceeded Consensus expectations for a 0.3% decline. Lower energy prices pulled down the total but excluding food & energy prices rose 0.6%, an increase that fully [...]
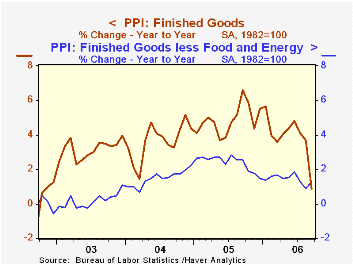
The overall producer price index dropped 1.3% last month and by far exceeded Consensus expectations for a 0.3% decline. Lower energy prices pulled down the total but excluding food & energy prices rose 0.6%, an increase that fully reversed the declines during the prior two months. Expectations had been for a 0.2% increase in the core PPI.
Finished energy goods prices dropped 8.4% (-1.6% y/y), led lower by a 22.2% m/m plunge in gasoline prices (-13.3% y/y) and an 18.5% (-0.1% y/y) decline in fuel oil prices. Residential electric power prices also fell 0.1% (+7.1% y/y) but natural gas prices increased 1.8% (-1.2% y/y).
Finished consumer goods prices less food & energy reversed the prior month's decline and rose 0.5% (1.1% y/y). The gain very much reflected a 2.8% (-3.6% y/y) increase in passenger car prices that reversed an August drop. Household furniture prices fell 0.1% (+3.4% y/y).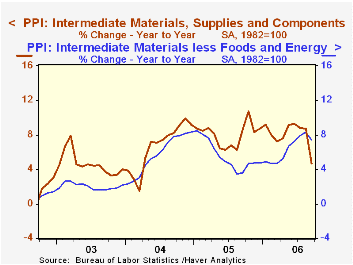
Capital equipment prices also were firm and rose 0.6% (1.5% y/y) for the first gain in three months. Light truck prices reversed the August drop and rose 3.5% (-4.8% y/y) while prices of pumps, compressors & equipment were strong again, rising 1.2% (4.3% y/y).
Intermediate goods prices dropped 1.4%, the first m/m decline since February, and prices less food & energy were similarly tame. The 0.1% increase was the smallest since August of last year.
The crude materials PPI dropped 3.4% due to a 13.3% (NSA, +0.8% y/y) drop in crude petroleum and a 5.5% skid in natural gas (NSA, -35.0% y/y). Less food & energy crude goods prices were, however, quite strong and rose 1.0% due to higher iron & steel scrap prices (4.4% y/y), higher prices for aluminum base scrap (29.2% y/y) and copper scrap prices which are up 70.9% y/y.
Why Are Yield Curves So Flat and Long Rates So Low Globally?, remarks by Federal Reserve Board Governor Randall S. Kroszner are available here.
| Producer Price Index | September | August | Y/Y | 2005 | 2004 | 2003 |
|---|---|---|---|---|---|---|
| Finished Goods | -1.3% | 0.1% | 0.9% | 4.9% | 3.6% | 3.2% |
| Core | 0.6% | -0.4% | 1.3% | 2.4% | 1.5% | 0.2% |
| Intermediate Goods | -1.4% | 0.4% | 4.7% | 8.0% | 6.6% | 4.7% |
| Core | 0.1% | 0.4% | 7.4% | 5.5% | 5.7% | 2.0% |
| Crude Goods | -3.4% | 2.2% | -7.8% | 14.6% | 17.5% | 25.1% |
| Core | 1.0% | -2.8% | 19.7% | 4.8% | 26.5% | 12.4% |

Tom Moeller
AuthorMore in Author Profile »Prior to joining Haver Analytics in 2000, Mr. Moeller worked as the Economist at Chancellor Capital Management from 1985 to 1999. There, he developed comprehensive economic forecasts and interpreted economic data for equity and fixed income portfolio managers. Also at Chancellor, Mr. Moeller worked as an equity analyst and was responsible for researching and rating companies in the economically sensitive automobile and housing industries for investment in Chancellor’s equity portfolio. Prior to joining Chancellor, Mr. Moeller was an Economist at Citibank from 1979 to 1984. He also analyzed pricing behavior in the metals industry for the Council on Wage and Price Stability in Washington, D.C. In 1999, Mr. Moeller received the award for most accurate forecast from the Forecasters' Club of New York. From 1990 to 1992 he was President of the New York Association for Business Economists. Mr. Moeller earned an M.B.A. in Finance from Fordham University, where he graduated in 1987. He holds a Bachelor of Arts in Economics from George Washington University.
More Economy in Brief


