 Global| Feb 18 2005
PPI As Expected, But Core Prices Surged
by:Tom Moeller
|in:Economy in Brief
Summary
The PPI for finished goods rose an expected 0.3% in January and reversed the revised 0.3% December decline. Excluding food & energy, however, prices rose 0.8% and were quite a bit stronger than Consensus expectations for a 0.2% rise. [...]
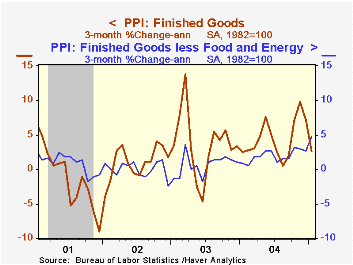
The PPI for finished goods rose an expected 0.3% in January and reversed the revised 0.3% December decline. Excluding food & energy, however, prices rose 0.8% and were quite a bit stronger than Consensus expectations for a 0.2% rise.
Core finished consumer goods prices jumped 0.9% (2.6% y/y) led by a 1.1% (2.6% y/y) jump in nondurable prices. Strength was highlighted by, but not limited to, a 3.1% rise in prices of tobacco products. Consumer durable prices also rose a firm 0.7% (2.8% y/y) and capital goods prices were up 0.6% (2.8% y/y) as gains in several categories offset lower computer prices.
Finished energy prices fell 1.0% (+9.9% y/y) as not seasonally adjusted gains in most prices were more than anticipated by the seasonal adjustment factors. Finished food prices fell 0.2% (+4.2% y/y).
Intermediate goods prices also rose a firm 0.4% as food prices gained 0.9% (0.4% y/y) and core intermediate prices jumped 0.8% reflecting higher fertilizer prices and renewed strength in lumber prices.
Crude prices slumped another 2.0% pulled down by a 2.5% decline in core crude prices as iron & steel scrap prices fell sharply again (+23.3% y/y). During the last thirty years "core" crude prices have been a fair indicator of industrial sector activity with a 48% correlation between the six month change in core crude prices and the change in factory sector industrial production.
| Producer Price Index | Jan | Dec | Y/Y | 2004 | 2003 | 2002 |
|---|---|---|---|---|---|---|
| Finished Goods | 0.3% | -0.3% | 4.3% | 3.6% | 3.2% | -1.3% |
| Core | 0.8% | 0.2% | 2.7% | 1.5% | 0.2% | 0.1% |
| Intermediate Goods | 0.4% | -0.1% | 8.7% | 6.6% | 4.6% | -1.5% |
| Core | 0.8% | 0.5% | 8.5% | 5.7% | 2.0% | -0.5% |
| Crude Goods | -2.0% | -3.0% | 10.8% | 17.6% | 25.1% | -10.6% |
| Core | -2.5% | -1.3% | 13.1% | 26.6% | 12.4% | 3.8% |

Tom Moeller
AuthorMore in Author Profile »Prior to joining Haver Analytics in 2000, Mr. Moeller worked as the Economist at Chancellor Capital Management from 1985 to 1999. There, he developed comprehensive economic forecasts and interpreted economic data for equity and fixed income portfolio managers. Also at Chancellor, Mr. Moeller worked as an equity analyst and was responsible for researching and rating companies in the economically sensitive automobile and housing industries for investment in Chancellor’s equity portfolio. Prior to joining Chancellor, Mr. Moeller was an Economist at Citibank from 1979 to 1984. He also analyzed pricing behavior in the metals industry for the Council on Wage and Price Stability in Washington, D.C. In 1999, Mr. Moeller received the award for most accurate forecast from the Forecasters' Club of New York. From 1990 to 1992 he was President of the New York Association for Business Economists. Mr. Moeller earned an M.B.A. in Finance from Fordham University, where he graduated in 1987. He holds a Bachelor of Arts in Economics from George Washington University.
More Economy in Brief


