 Global| Jan 14 2021
Oil Drives Gains U.S. Import and Export Prices
Summary
• Import prices rose 0.9% in December as fuel prices jumped 7.8%. • Export prices gained 1.1% with fuels up 8.9%. • Excluding fuels both import and export prices increased 0.4%. Import prices grew a greater-than-expected 0.9% during [...]
• Import prices rose 0.9% in December as fuel prices jumped 7.8%.
• Export prices gained 1.1% with fuels up 8.9%.
• Excluding fuels both import and export prices increased 0.4%.
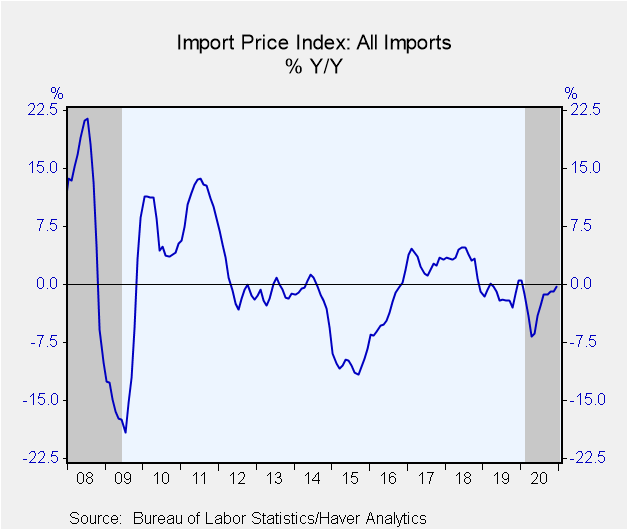
Import prices grew a greater-than-expected 0.9% during December (-0.3% year-on-year), following a slightly upwardly revised 0.2% gain in November (was 0.1%). The Action Economics Forecast Survey anticipated 0.6% growth. On an annual average basis, import prices fell 2.5% y/y in 2020 after declining 1.3% in 2019. These figures are not seasonally adjusted and do not include import duties.
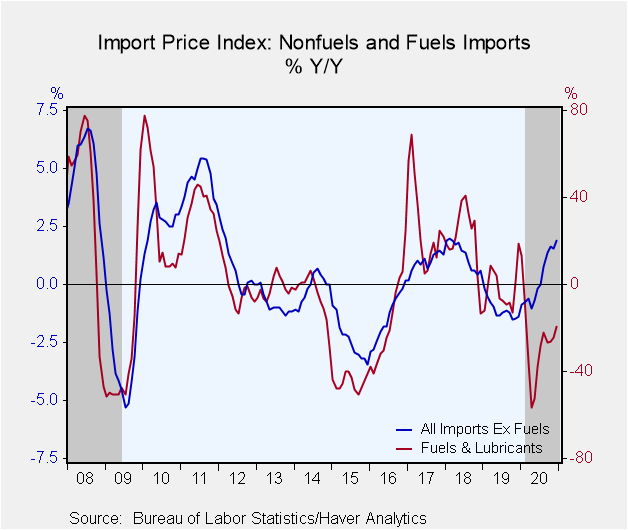
The increase in import prices last month was primarily driven by a 7.8% jump in fuel import costs (-19.5% y/y). Nonfuel import prices rose 0.4% (1.9% y/y). Among key end-use categories, capital goods, the largest category of imports, was unchanged (1.0% y/y). Nonauto consumer goods prices the second largest, ticked up 0.1% (0.2% y/y). Motor vehicle prices were also unchanged (1.1% y/y).
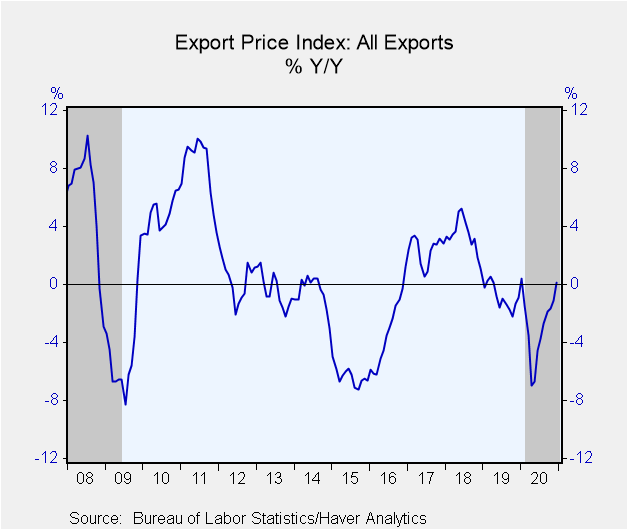
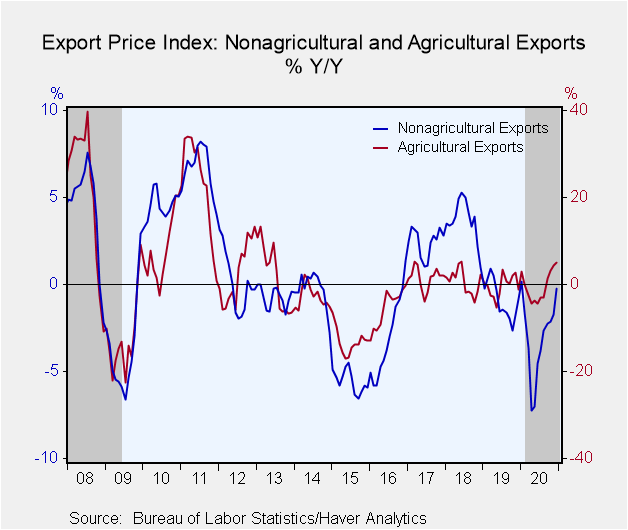
Export prices increased 1.1% in December (0.2% y/y), following a slightly upwardly revised 0.7% gain in November (was 0.6%). Forecasters' expected 0.5% growth in December. On an annual average basis, export prices fell 2.8% y/y in 2020 after declining 0.9% in 2019. Nonagricultural prices jumped 1.3% in December (-0.2% y/y) while agricultural prices were up 0.6% (5.1% y/y). Among key end use categories, capital goods prices, the largest category making up over one-third of all goods exports, ticked up 0.1% in December (0.5% y/y). Nonagricultural industrial supplies & materials – which includes fuels and is the second largest category – jumped 3.4% (-1.6% y/y). Nonauto consumer goods prices rose 0.4% (-0.1% y/y).
The import and export price series can be found in Haver's USECON database. Detailed figures are available in the USINT database. The expectations figure from the Action Economics Forecast Survey is in the AS1REPNA database.
| Import/Export Prices (NSA, %) | Dec | Nov | Oct | Dec Y/Y | 2020 | 2019 | 2018 |
|---|---|---|---|---|---|---|---|
| Imports - All Commodities | 0.9 | 0.2 | -0.1 | -0.3 | -2.5 | -1.3 | 3.1 |
| Fuels | 7.8 | 4.8 | -1.0 | -19.5 | -27.8 | -2.1 | 20.8 |
| Nonfuels | 0.4 | -0.2 | 0.0 | 1.9 | 0.3 | -1.1 | 1.3 |
| Exports - All Commodities | 1.1 | 0.7 | 0.2 | 0.2 | -2.8 | -0.9 | 3.4 |
| Agricultural | 0.6 | 3.5 | 3.5 | 5.1 | -0.3 | -0.4 | 0.6 |
| Nonagricultural | 1.3 | 0.3 | -0.2 | -0.2 | -3.1 | -0.9 | 3.7 |
Gerald D. Cohen
AuthorMore in Author Profile »Gerald Cohen provides strategic vision and leadership of the translational economic research and policy initiatives at the Kenan Institute of Private Enterprise.
He has worked in both the public and private sectors focusing on the intersection between financial markets and economic fundamentals. He was a Senior Economist at Haver Analytics from January 2019 to February 2021. During the Obama Administration Gerald was Deputy Assistant Secretary for Macroeconomic Analysis at the U.S. Department of Treasury where he helped formulate and evaluate the impact of policy proposals on the U.S. economy. Prior to Treasury, he co-managed a global macro fund at Ziff Brothers Investments.
Gerald holds a bachelor’s of science from the Massachusetts Institute of Technology and a Ph.D. in Economics from Harvard University and is a contributing author to 30-Second Money as well as a co-author of Political Cycles and the Macroeconomy.
More Economy in Brief
 Global| Feb 05 2026
Charts of the Week: Balanced Policy, Resilient Data and AI Narratives
by:Andrew Cates


