 Global| Nov 13 2006
OECD Leaders Rose
by:Tom Moeller
|in:Economy in Brief
Summary
The Leading Index of the major 7 OECD economies increased 0.4% in September after an upwardly revised 0.1% August gain. Declines during the prior three months were revised slightly shallower. The index's six month growth rate, as a [...]
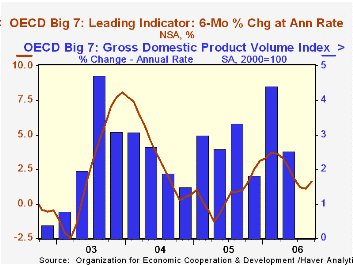
The Leading Index of the major 7 OECD economies increased 0.4% in September after an upwardly revised 0.1% August gain. Declines during the prior three months were revised slightly shallower. The index's six month growth rate, as a result, improved moderately to 1.6%.
During the last ten years there has been a 64% correlation between the change in the leading index and the q/q change in the GDP Volume Index for the Big Seven OECD countries.
The U.S. leading indicators jumped 0.8% after an upwardly revised 0.2% August increase. These gains followed four consecutive months of decline and improved the index's six month growth rate to 2.6%. Better consumer sentiment and a surge in new orders for durable goods led the September rise. The correlation between the leaders' growth rate and U.S. real GDP growth has been a high 73% during the last ten years.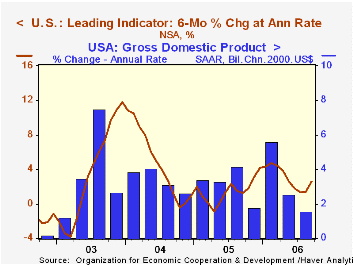
The leading index for the European Union (15 countries) rose a modest 0.1% for the third month in the last four, though the index's six month growth rate fell to 2.4%, the lowest in a year. During the last ten years there has been a 59% correlation between the change in the leading index and the quarterly change in the European Union GDP volume index.
In France the leaders rose 0.3% for the ninth consecutive monthly increase and the gains left the series' six month growth rate steady at 2.7%. During the last ten years there has been a 54% correlation between the leaders' growth rate and growth in France's real GDP, up 4.9% (AR, 2.6% y/y) during 2Q. Consumer confidence improved markedly and industrial sector prospects added to earlier gains.
The German leading index rose 0.1% for the fourth consecutive month. Despite upward revisions, the six month growth rate fell to 3.8%, its worst in one year. During the last ten years there has been a 32% correlation between the change in the German leading index and the quarterly change in GDP volume. Most of the leaders' September components fell though the tendency of orders inflow improved. 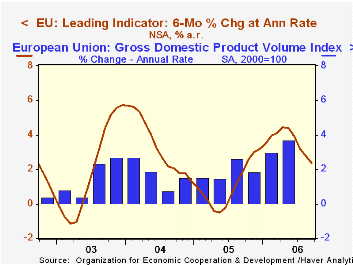
The Italian leading index fell for the third straight month, by 0.2%, and pulled the series' six month growth rate even more negative, to -0.5%. Improvement in most component series was offset by a sharp rise in 3 month interest rates.
The leading index in Japan rose 0.1% but the sharp 0.5% decline previously reported for August was revised up to a 0.1% uptick. The index's six month growth rate stabilized a still-negative -2.0%. Movement amongst the component series has been mixed and the leaders' correlation with Japan's real economic growth has been a meaningful 41% during the last ten years.
The UK leaders ticked up 0.1% after a slight August decline and left the six month growth rate little changed at a low 0.7%. During the last ten years there has been a 36% correlation between the leaders' growth rate and U.K. real GDP growth.
The Canadian leaders were unchanged after an upwardly revised 0.1% August gain, but the spike in July was lowered to 0.7%. The index's six month growth rate, consequently, fell to a still-improved 3.1%. The correlation of the leaders' growth with Canadian real GDP has been 49% during the last ten years.
The latest OECD Leading Indicator report can be found here.
How Does Capital Account Liberalization Affect Economic Growth? is a Webcast from the International Monetary Fund and can be viewed here.
| OECD | September | August | Y/Y | 2005 | 2004 | 2003 |
|---|---|---|---|---|---|---|
| Composite Leading Index | 105.63 | 105.16 | 2.5% | 102.96 | 102.45 | 97.92 |
| 6 Month Growth Rate | 1.6% | 1.1% | -- | 0.7% | 3.6% | 2.6% |

Tom Moeller
AuthorMore in Author Profile »Prior to joining Haver Analytics in 2000, Mr. Moeller worked as the Economist at Chancellor Capital Management from 1985 to 1999. There, he developed comprehensive economic forecasts and interpreted economic data for equity and fixed income portfolio managers. Also at Chancellor, Mr. Moeller worked as an equity analyst and was responsible for researching and rating companies in the economically sensitive automobile and housing industries for investment in Chancellor’s equity portfolio. Prior to joining Chancellor, Mr. Moeller was an Economist at Citibank from 1979 to 1984. He also analyzed pricing behavior in the metals industry for the Council on Wage and Price Stability in Washington, D.C. In 1999, Mr. Moeller received the award for most accurate forecast from the Forecasters' Club of New York. From 1990 to 1992 he was President of the New York Association for Business Economists. Mr. Moeller earned an M.B.A. in Finance from Fordham University, where he graduated in 1987. He holds a Bachelor of Arts in Economics from George Washington University.
More Economy in Brief


