 Global| Oct 09 2006
OECD Leaders: Four Months Down
by:Tom Moeller
|in:Economy in Brief
Summary
The Leading Index of the major 7 OECD economies slipped another 0.1% during August after 0.2% declines during the prior two months, revised slightly shallower from the earlier reports. August was, however, the fourth consecutive month [...]
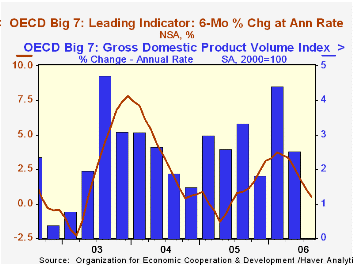
The Leading Index of the major 7 OECD economies slipped another 0.1% during August after 0.2% declines during the prior two months, revised slightly shallower from the earlier reports. August was, however, the fourth consecutive month of slippage and that has not occurred since 2002. The declines lowered the index's six month growth rate to 0.5%, the lowest in more than a year.
During the last ten years there has been a 64% correlation between the change in the leading index and the q/q change in the GDP Volume Index for the Big Seven OECD countries.
The U.S. leading indicators were unchanged for the second month but have fallen 0.4% during the last five months. That dropped the six month growth rate to 1.2%, the lowest since Spring 2005. The weakness has been led by lower construction starts but consumer sentiment, new orders for durable goods and share prices improved. The correlation between the leaders' growth rate and U.S. real GDP growth has been a high 73% during the last ten years.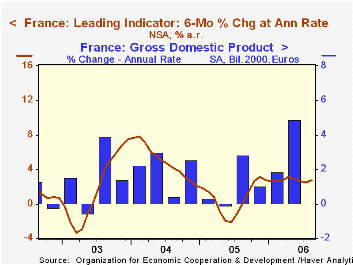
The leading index for the European Union (15 countries) fell 0.2% and the index's six month growth rate fell to 2.9%, the lowest since last November. During the last ten years there has been a 59% correlation between the change in the leading index and the quarterly change in the European Union GDP volume index.
The German leading index fell 0.1% for the second consecutive month but a previously reported 0.5% July decline was revised to -0.1%. and June was revised up to no change. The six month growth rate nevertheless fell to 3.9%, its worst in about one year. During the last ten years there has been a 32% correlation between the change in the German leading index and the quarterly change in GDP volume. Weakness in the leaders has been led by a worsening, negative interest rate spread and lower export orders.
In France the leaders rose 0.4% for the eighth consecutive monthly increase. The gains have left the series' six month growth rate at 2.7%. During the last ten years there has been a 54% correlation between the leaders' growth rate and growth in France's real GDP, up 4.9% (AR, 2.6% y/y) last quarter. Consumer confidence has improved markedly and industrial sector prospects also are up.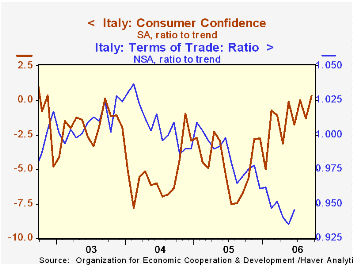
The Italian leading index fell sharply again. The 0.7% August decline lowered the series' six month growth rate to a negative 2.0%, the worst since 2003. Worsening terms of trade & higher interest rates account the weakness and have offset improved consumer confidence.
The UK leaders fell 0.2% for the second down month in the last three. That lowered the six month growth rate 0.8%, its worst since January. During the last ten years there has been a 36% correlation between the leaders' growth rate and U.K. real GDP growth.
The Canadian leaders also fell 0.2% after an upwardly revised 1.1% July spike. The index's six month growth rate held at a much improved 3.9%, its best in two years. The correlation of the leaders' growth with Canadian real GDP has been 49% during the last ten years.
The leading index in Japan fell 0.5%, the sixth consecutive monthly decline which dropped the index's six month growth rate to -3.6%. Share prices (recently), interest rate spreads and construction starts all are down from their highs. The leaders' correlation with Japan's real economic growth has been a meaningful 41% during the last ten years.
The latest OECD Leading Indicator report can be found here.
Do Inflation Targeters Outperform Non-targeters from the Federal Reserve Bank of St. Louis is available here.
The Exchange Rate-Consumer Price Puzzle from the Federal Reserve Bank of San Francisco can be found here.
| OECD | August | July | Y/Y | 2005 | 2004 | 2003 |
|---|---|---|---|---|---|---|
| Composite Leading Index | 104.82 | 104.97 | 1.8% | 102.97 | 102.49 | 98.10 |
| 6 Month Growth Rate | 0.5% | 1.1% | -- | 0.7% | 3.5% | 2.6% |
by Louise Curley October 9, 2006
A diverse group of countries reported Industrial Production data for August. Most important was that of Germany, the largest European economy. The other reporting countries were relatively small nations among the emerging economies of Eastern Europe, the Middle East and the Pacific Rim, namely, Slovakia, Jordan and Turkey and Malaysia.
We have adjusted all the indexes to a common base 1999=100. The choice of base was limited to 1999 because data for Jordan, which has a base of 1999=100, were not available for any of the other base years--2000 for Germany and Slovakia, 1997 for Turkey and 1993 for Malaysia.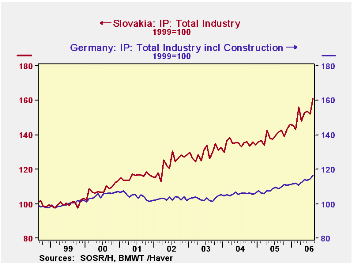
German Industrial Production rose almost 2% from July and was over &% above August, 2005. The rise exceeded consensus estimates and suggests a solid increase in GDP in the third quarter. In terms of magnitude, which cannot be discerned from index numbers, Germany far outweighs the other nations reporting today. But in terms of growth rates, which can be derived from index numbers, the smaller nations doubled or tripled Germany's growth during this period. Industrial production in Germany is only 17% above the average of 1999, while the comparable figure for Slovakia, for example, is 61%. The first chart compares the growth in industrial production in Germany and in Slovakia.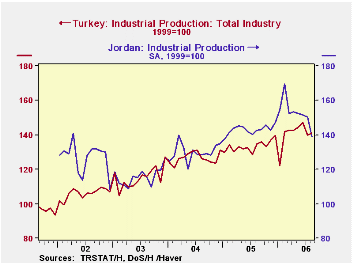
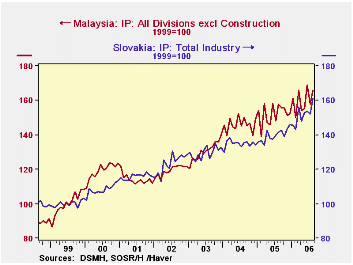
Among the small nations reporting today, Malaysia and Slovakia have been the fastest growers.Malaysian industrial production in August was 66% above the 1999 average and, as noted above, the comparable figure for Slovakian industrial production was 61%. The second chart shows that Malaysia and Slovakia have experienced similar trends in industrial production since 1999.
While industrial production in Turkey and Jordan is currently about 40% above the average of 1999, Jordan reported a decline of almost 8% in August from July and a 2.7% decline from August 2005. Economic conditions in Jordan, have probably been affected by the turmoil in the Middle East during the summer months. Turkey, on the other hand reported a 1.% increase in industrial production in July and almost a 5% increase over August, 2005. Since, January 2002, the first date that data for Jordan are available, both Jordan and Turkey have shown similar growth rates, as shown in the third chart. Currently, industrial production in Jordan is 38% above the average of 1999 while that of Turkey is 41%.
| INDUSTRIAL PRODUCTION (1999=100) | Jul 06 | Jun 06 | Jul 05 | M/M % | Y/Y % | 2005 | 2004 | 2003 |
|---|---|---|---|---|---|---|---|---|
| Germany | 116.6 | 114.4 | 108.7 | 1.92 | 7.34 | 107.7 | 105.8 | 103.2 |
| Slovakia | 161.1 | 152.0 | 141.5 | 5.98 | 13.25 | 139.8 | 134.9 | 129.5 |
| Jordan | 138.8 | 150.3 | 142.7 | -7.68 | -2.74 | 143.1 | 130.0 | 115.9 |
| Turkey | 141.3 | 139.8 | 134.8 | 1.10 | 4.89 | 133.3 | 126.5 | 115.2 |
| Malaysia | 165.7 | 157.7 | 157.6 | 5.06 | 5.14 | 151.9 | 146.0 | 130.6 |
Tom Moeller
AuthorMore in Author Profile »Prior to joining Haver Analytics in 2000, Mr. Moeller worked as the Economist at Chancellor Capital Management from 1985 to 1999. There, he developed comprehensive economic forecasts and interpreted economic data for equity and fixed income portfolio managers. Also at Chancellor, Mr. Moeller worked as an equity analyst and was responsible for researching and rating companies in the economically sensitive automobile and housing industries for investment in Chancellor’s equity portfolio. Prior to joining Chancellor, Mr. Moeller was an Economist at Citibank from 1979 to 1984. He also analyzed pricing behavior in the metals industry for the Council on Wage and Price Stability in Washington, D.C. In 1999, Mr. Moeller received the award for most accurate forecast from the Forecasters' Club of New York. From 1990 to 1992 he was President of the New York Association for Business Economists. Mr. Moeller earned an M.B.A. in Finance from Fordham University, where he graduated in 1987. He holds a Bachelor of Arts in Economics from George Washington University.
More Economy in Brief
 Global| Feb 05 2026
Charts of the Week: Balanced Policy, Resilient Data and AI Narratives
by:Andrew Cates


