 Global| May 26 2004
New Home Sales Down
by:Tom Moeller
|in:Economy in Brief
Summary
Sales of new one-family homes fell 11.8% in April to 1.093M. Consensus estimates had been for a lesser decline to 1.200 million. March sales were revised slightly higher. The figures contrast with yesterday's report of a 2.5% m/m gain [...]
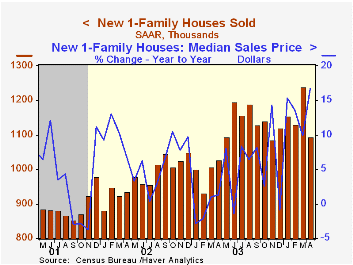
Sales of new one-family homes fell 11.8% in April to 1.093M. Consensus estimates had been for a lesser decline to 1.200 million. March sales were revised slightly higher.
The figures contrast with yesterday's report of a 2.5% m/m gain sales of existing single family homes. These new home sales data from the US Census Department reflect current sales versus the existing home sale figures which reflect closings on past sales.
Nevertheless, sales last month were up 6.4% from April 2003, although the rate of gain has eased considerably from the peaks above 20%.
Sales fell hardest in the South with a 22.0% (-5.5% y/y) drop. Sales also fell 2.5% (+1.3% Y/Y) in the Northeast, down for the third consecutive month, and in the West where they fell 9.4% (+16.5% y/y). Sales rose 10.8% (25.6% y/y) in the Midwest.
The median price of a new single family home rose 8.8% to $221,200 (16.7% y/y).
| Homes Sales (000s, AR) | April | Mar | Y/Y | 2003 | 2002 | 2001 |
|---|---|---|---|---|---|---|
| New Single-Family | 1,093 | 1,239 | 6.4% | 1,088 | 977 | 907 |
by Tom Moeller May 26, 2004
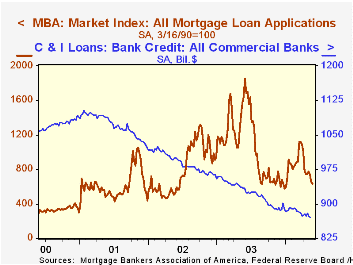
The index of mortgage applications compiled by the Mortgage Bankers Association fell another 3.3% (-61.3% y/y) last week.
A similar pattern of decline has been exhibited by commercial & industrial (C&I) loans. C&I loans extended by all commercial banks in the US were down 7.0% y/y in the latest week, a decline that began early in 2001.
"Why No Business Loan Growth?" from the Federal Reserve Bank of St. Louis can be found here.
Applications to refinance mortgages cratered 6.7% last week on top of the double digit declines of the prior several periods. Purchase applications fell another 1.0% w/w but for the month still are 1.8% ahead of the April average.
During the last ten years there has been a 56% correlation between the y/y change in purchase applications and the change in new plus existing home sales.
The effective interest rate on a conventional 30-Year mortgage rose slightly to 6.53% from 6.48% the week prior. The average for April was 6.16% versus 5.65% averaged in March. The effective rate on a 15-year mortgage also ticked up to 5.97% from 5.93% the week prior. The average for April was 5.54% versus 5.00% in March.
The Mortgage Bankers Association surveys between 20 to 35 of the top lenders in the U.S. housing industry to derive its refinance, purchase and market indexes. The weekly survey accounts for more than 40% of all applications processed each week by mortgage lenders. Visit the Mortgage Bankers Association site here.
| MBA Mortgage Applications (3/16/90=100) | 05/21/04 | 05/14/04 | 2003 | 2002 | 2001 |
|---|---|---|---|---|---|
| Total Market Index | 632.4 | 654.1 | 1,067.9 | 799.7 | 625.6 |
| Purchase | 449.8 | 454.2 | 395.1 | 354.7 | 304.9 |
| Refinancing | 1,694.9 | 1,816.9 | 4,981.8 | 3,388.0 | 2,491.0 |
by Tom Moeller May 26, 2004
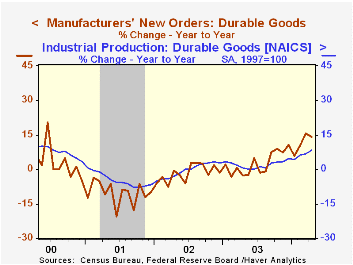
Durable goods orders fell 2.9% last month but the increase in March was revised up to a 5.7% jump from the advance report of a 3.4% gain. Consensus expectations had been for a 0.5% decline in April orders.
Transportation orders dropped 4.7% following a 4.1% jump in March, pulled down by a decline in motor vehicle orders and lower aircraft orders. Excluding the transportation sector, durable goods orders fell 2.1% (+16.9% y/y) following a 6.3% surge in March.
Non-defense capital goods orders fell 2.7% but the gain in March is now pegged at 6.0% versus the advance report of a 2.1% gain. Excluding aircraft and parts, orders fell 3.5% (+13.2% y/y) after a 6.0% March jump, revised up from 2.4%.
Orders for computers & electronic products lost all of the March gain, posting a 4.1% (+13.9% y/y) decline. Lower orders for semiconductors dragged the sector down while computer orders surged 5.4% (8.8% y/y) and orders for communications equipment jumped 16.6% (15.2% y/y).
Machinery orders fell 4.9% (18.9% y/y) but orders for electrical equipment, appliances & components jumped 3.4% (11.9% y/y).
Shipments of durable goods slipped 0.8% (12.5% y/y) following an upwardly revised 4.3% gain in March. Excluding transportation, shipments added 0.4% (13.8% y/y) to the upwardly revised 5.6% gain in March.
Durable inventories rose 0.5% (-0.9% y/y) for the sixth gain in the last seven months.
| NAICS Classification | April | Mar | Y/Y | 2003 | 2002 | 2001 |
|---|---|---|---|---|---|---|
| Durable Goods Orders | 2.9% | 5.7% | 13.9% | 2.6% | -1.7% | -10.5% |
| Non-defense Capital Goods | -2.7% | 6.0% | 12.6% | 5.6% | -7.2% | -15.5% |

Tom Moeller
AuthorMore in Author Profile »Prior to joining Haver Analytics in 2000, Mr. Moeller worked as the Economist at Chancellor Capital Management from 1985 to 1999. There, he developed comprehensive economic forecasts and interpreted economic data for equity and fixed income portfolio managers. Also at Chancellor, Mr. Moeller worked as an equity analyst and was responsible for researching and rating companies in the economically sensitive automobile and housing industries for investment in Chancellor’s equity portfolio. Prior to joining Chancellor, Mr. Moeller was an Economist at Citibank from 1979 to 1984. He also analyzed pricing behavior in the metals industry for the Council on Wage and Price Stability in Washington, D.C. In 1999, Mr. Moeller received the award for most accurate forecast from the Forecasters' Club of New York. From 1990 to 1992 he was President of the New York Association for Business Economists. Mr. Moeller earned an M.B.A. in Finance from Fordham University, where he graduated in 1987. He holds a Bachelor of Arts in Economics from George Washington University.
More Economy in Brief


