 Global| Jun 02 2004
Mortgage Applications Down Further
by:Tom Moeller
|in:Economy in Brief
Summary
The index of mortgage applications compiled by the Mortgage Bankers Association fell 1.2% (-66.4% y/y) last week. For the month of May applications fell 18.6% from April and were down 57.0% from May '03. Applications to refinance [...]
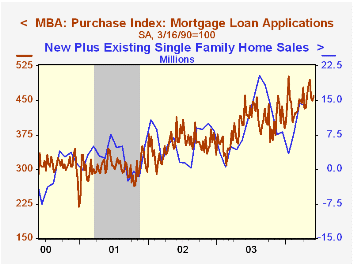
The index of mortgage applications compiled by the Mortgage Bankers Association fell 1.2% (-66.4% y/y) last week. For the month of May applications fell 18.6% from April and were down 57.0% from May '03.
Applications to refinance mortgages dropped 6.6% last week and the decline pulled the average level in May down 37.1% versus April, off 77.5% from May '03.
Purchase applications rose 2.2% w/w and for the month rose 1.4% versus the April average, up 1.5% versus last May.
During the last ten years there has been a 61% correlation between the y/y change in purchase applications and the change in new plus existing home sales.
The effective interest rate on a conventional 30-Year mortgage was little changed at 6.51%. The average for May was 6.53% versus 6.16% averaged in April. The effective rate on a 15-year mortgage also was little changed at 5.94. The May average was 5.97% versus 5.54% in April.
The Mortgage Bankers Association surveys between 20 to 35 of the top lenders in the U.S. housing industry to derive its refinance, purchase and market indexes. The weekly survey accounts for more than 40% of all applications processed each week by mortgage lenders. Visit the Mortgage Bankers Association site here.
| MBA Mortgage Applications (3/16/90=100) | 05/28/04 | 05/21/04 | 2003 | 2002 | 2001 |
|---|---|---|---|---|---|
| Total Market Index | 624.6 | 632.4 | 1,067.9 | 799.7 | 625.6 |
| Purchase | 459.8 | 449.8 | 395.1 | 354.7 | 304.9 |
| Refinancing | 1,583.6 | 1,694.9 | 4,981.8 | 3,388.0 | 2,491.0 |
by Tom Moeller June 2, 2004
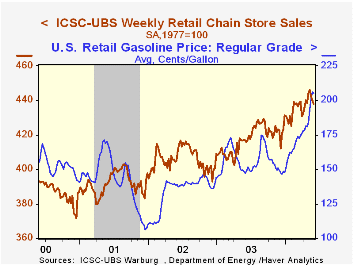
Chain store sales fell 0.5% last week following a like decline the week prior and a 0.8% decline the week before that, according to the International Council of Shopping Centers (ICSC)-UBS.
In May chain store sales rose 0.7% from the April average following a 0.4% rise during that month.
During the last ten years there has been a 59% correlation between y/y change in chain store sales and the change in non-auto retail sales less gasoline.
The ICSC-UBS retail chain-store sales index is constructed using the same-store sales reported by 78 stores of seven retailers: Dayton Hudson, Federated, Kmart, May, J.C. Penney, Sears and Wal-Mart.
Retail gasoline prices slipped to an average $2.05 per gallon last week (+39.2% y/y) but averaged $1.98 in May, up 10.3% from the April average of $1.80.
| ICSC-UBS (SA, 1977=100) | 05/29/04 | 05/22/04 | Y/Y | 2003 | 2002 | 2001 |
|---|---|---|---|---|---|---|
| Total Weekly Retail Chain Store Sales | 437.7 | 439.8 | 5.0% | 2.9% | 3.6% | 2.1% |

Tom Moeller
AuthorMore in Author Profile »Prior to joining Haver Analytics in 2000, Mr. Moeller worked as the Economist at Chancellor Capital Management from 1985 to 1999. There, he developed comprehensive economic forecasts and interpreted economic data for equity and fixed income portfolio managers. Also at Chancellor, Mr. Moeller worked as an equity analyst and was responsible for researching and rating companies in the economically sensitive automobile and housing industries for investment in Chancellor’s equity portfolio. Prior to joining Chancellor, Mr. Moeller was an Economist at Citibank from 1979 to 1984. He also analyzed pricing behavior in the metals industry for the Council on Wage and Price Stability in Washington, D.C. In 1999, Mr. Moeller received the award for most accurate forecast from the Forecasters' Club of New York. From 1990 to 1992 he was President of the New York Association for Business Economists. Mr. Moeller earned an M.B.A. in Finance from Fordham University, where he graduated in 1987. He holds a Bachelor of Arts in Economics from George Washington University.
More Economy in Brief


