 Global| Oct 13 2006
Lower Gasoline Prices Dropped U.S. Retail Sales
by:Tom Moeller
|in:Economy in Brief
Summary
Last month US retail sales fell an unexpected 0.4% after a little revised 0.1% August decline. Consensus expectations had been for a 0.2% September rise. The decline, however, was due to a 9.3% drop (-6.3% y/y) in sales at gasoline [...]
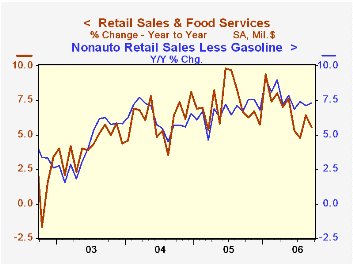
Last month US retail sales fell an unexpected 0.4% after a little revised 0.1% August decline. Consensus expectations had been for a 0.2% September rise.
The decline, however, was due to a 9.3% drop (-6.3% y/y) in sales at gasoline stations. That reflected a 13.4% m/m fall in gasoline prices to an average $2.56 per gallon. Gas prices in October are lower still at an average $2.29.Less gasoline, September nonauto retail sales rose 0.8% (7.3% y/y), double the prior month's increase.
Sales by motor vehicle & parts dealers were unchanged (5.6% y/y) as unit vehicle sales rose 3.5% m/m to 16.63M.
Excluding autos, retail sales fell 0.5% after an unrevised 0.2% increase during August.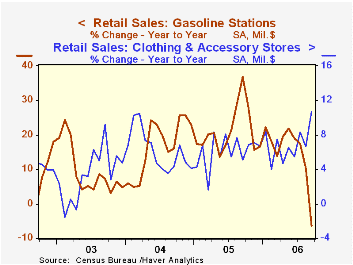
Sales of discretionary items were quite firm last month. Apparel store sales spiked 3.0% (10.7% y/y) higher while sales at general merchandise stores also were firm and posted a 1.1% (6.3% y/y) increase. Sales at furniture, home furnishings & appliance stores lagged with just a 0.2% (4.5% y/y) gain after a slight decline during August. Sales of nonstore retailers (internet & catalogue) rose 0.3% (12.5% y/y) after a little revised 2.1% July spike.
Building material sales also were strong and increased 1.1% (12.9% y/y) while food service (restaurant) and drinking service sales rose 1.0% (8.3% y/y).
The latest Beige Book covering regional economic conditions prepared by the Federal Reserve Bank of Richmond can be found here.
| September | August | Y/Y | 2005 | 2004 | 2003 | |
|---|---|---|---|---|---|---|
| Retail Sales & Food Services | -0.4% | -0.1% | 5.5% | 7.2% | 6.2% | 4.2% |
| Excluding Autos | -0.5% | 0.2% | 5.5% | 8.2% | 7.2% | 4.7% |
by Tom Moeller October 13, 2006
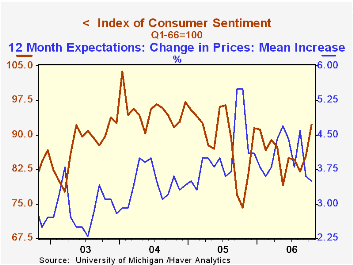
The preliminary reading of consumer sentiment in October from the University of Michigan rose 8.1% versus last month to 92.3. That gain doubled September's 4.1% rise and lifted the level to the highest since July of last year. Consensus expectations had been for a lesser rise to 86.1.
During the last ten years there has been a 77% correlation between the level of consumer sentiment and the y/y change in real consumer spending and during those ten years sentiment has a 68% correlation with the change in nonfarm payrolls.
Expected inflation during the next year fell further to 3.5% from 3.6% last month, its lowest level since January 2005. Since 1980 there has been an inverse 63% correlation between the level of sentiment and expected inflation during the next year. The five to ten year expected rate of inflation actually rose to 3.6% its highest level since May.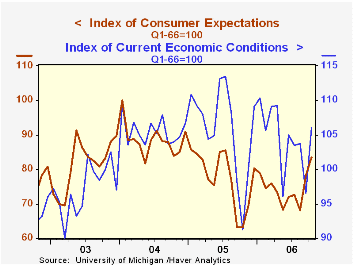
Expectations for the economy rose 6.6% m/m to the highest level since July of last year. Expected business conditions next year improved sharply and over the next five years they improved to the highest since June 2005. The expected change in personal finances added moderately to the sharp gain during September.
The reading of current economic conditions surged nearly 10% m/m and rose to the highest level since April. The current read of personal finances (19.8% y/y) rose to the best level since April and perceived buying conditions for large household goods recouped all of the prior month's decline and rose 15.8% y/y.
Consumers' opinion about gov't economic policy rose 6.1% (11.5% y/y) after three months having been unchanged.
The University of Michigan survey is not seasonally adjusted.The mid-month survey is based on telephone interviews with 250 households nationwide on personal finances and business and buying conditions. The survey is expanded to a total of 500 interviews at month end.Globalization: A Force for Good? yesterday's remarks by Fed Governor Frederic S. Mishkin are available here.
| University of Michigan | October (Prelim.) | September | August | Y/Y | 2005 | 2004 | 2003 |
|---|---|---|---|---|---|---|---|
| Consumer Sentiment | 92.3 | 85.4 | 82.0 | 24.4% | 88.6 | 95.2 | 87.6 |
| Current Conditions | 106.1 | 96.6 | 103.8 | 16.3% | 105.9 | 105.6 | 97.2 |
| Expectations | 83.4 | 78.2 | 68.0 | 32.0% | 77.4 | 88.5 | 81.4 |
by Tom Moeller October 13, 2006
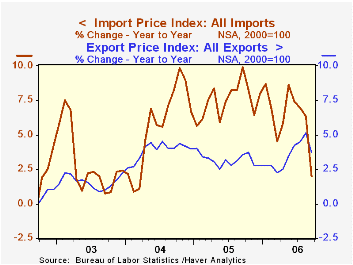
Total import prices fell 2.1% last month after an unrevised 0.8% August increase. The decline outpaced Consensus expectations for a large 1.5% decline.
Prices of petroleum imports plunged 10.3% after a 2.1% August gain. In October, the price of Brent crude oil already has fallen another 8.5% to $57.07 per bbl. Less petroleum, import prices increased a modest 0.1% after the firm 0.5% rise during August.
During the last ten years there has been a 66% (negative) correlation between the nominal trade-weighted exchange value of the US dollar vs. major currencies and the y/y change in non oil import prices. The correlation is a lower 47% against a broader basket of currencies and a lower 57% against the real value of the dollar.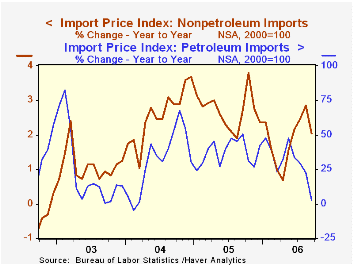
Have U.S. Import Prices Become Less Responsive to Changes in the Dollar? from the Federal Reserve Bank of New York can be found here.
Capital goods prices were unchanged (-0.2% y/y) for the second month. Excluding computers, capital good prices rose 0.2% (1.8% y/y) after having been unchanged during August. Prices for nonauto consumer goods rose 0.1% (0.9% y/y) for the second month while prices for nonoil industrial supplies & materials rose 0.4% (6.6% y/y) after a little revised 1.5% August increase.
Export prices fell 0.5% as both agricultural prices fell 0.7% (4.4% y/y) and nonagricultural commodities prices dropped 0.5% (+3.7% y/y).
Oil Prices and the U.S. Trade Deficit from the Federal Reserve Bank of San Francisco is available here.
| Import/Export Prices (NSA) | September | August | Y/Y | 2005 | 2004 | 2003 |
|---|---|---|---|---|---|---|
| Import - All Commodities | -2.1% | 0.8% | 2.0% | 7.5% | 5.6% | 2.9% |
| Petroleum | -10.3% | 2.1% | 2.9% | 37.6% | 30.5% | 21.0% |
| Non-petroleum | 0.1% | 0.5% | 2.0% | 2.7% | 2.6% | 1.1% |
| Export- All Commodities | -0.5% | 0.4% | 3.7% | 3.2% | 3.9% | 1.6% |
by Tom Moeller October 13, 2006
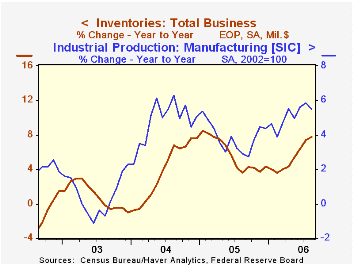
Total business inventories rose 0.6% in August following an upwardly revised 0.7% July gain. Consensus expectations had been for a 0.5% increase. The gain lifted the y/y rate of business inventory accumulation to its highest (7.7%) since early 2005.
During the last ten years there has been a 57% correlation between the y/y change in business inventories and the change in factory sector industrial production. Using quarterly figures, there has been an 84% correlation between the change in real private nonfarm inventories and production.
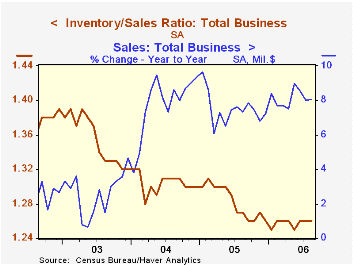
Business sales rose 0.8% (8.1% y/y) on the strength of higher wholesale sales (12.5% y/y) and higher factory shipments (6.1% y/y). The inventory to sales ratio was stable for the third month at 1.26, but was above the May low of 1.25.
Retail inventories rose 0.5% and that's the same rate of increase excluding autos (4.4% y/y) which rose 0.5% (14.1% y/y). Higher building materials inventories led the rise with a 1.0% (9.4% y/y) gain. General merchandise inventories grew 0.7% (0.7% y/y) and clothing store inventories rose 0.4% (5.8 y/y). Furniture inventories fell 0.3% (+4.4% y/y).
Wholesale inventories surged another 1.1% (9.7% y/y) in August though petroleum inventories fell 6.5% (+9.7% y/y). Drug and chemical inventories surged while durables rose 0.9% (10.0% y/y).
Factory inventories rose 0.4%, half the prior month's rate of accumulation.
Understanding How Employment Responds to Productivity Shocks in a Model with Inventories from the Federal Reserve Bank of Richmond can be found here.
| Business Inventories | August | July | Y/Y | 2005 | 2004 | 2003 |
|---|---|---|---|---|---|---|
| Total | 0.6% | 0.7% | 7.7% | 4.4% | 7.6% | -1.0% |
| Retail | 0.5% | 0.4% | 7.5% | 2.7% | 6.7% | 3.8% |
| Retail excl. Autos | 0.5% | 0.3% | 4.4% | 4.5% | 7.1% | 1.9% |
| Wholesale | 1.1% | 0.9% | 9.7% | 7.1% | 9.8% | 1.8% |
| Manufacturing | 0.4% | 0.8% | 6.5% | 4.0% | 6.9% | -7.4% |
by Carol Stone October 13, 2006

Last week, we discussed the CPIs of two small Eastern European countries, who were quick in reporting their September data; in both cases, Estonia and Slovenia, there was evidence that the recent fall in energy prices was already helping cut inflation, and nip a price problem in the bud. Today, we hear from a much larger European economy, France. Sure enough, lined out in some detail, is a clear statement about the fall in oil product prices.
France's CPI has been pretty well behaved all along, and we've commented more than once about how reassuring it has been that so many countries have not suffered a major, sustained acceleration in overall consumer prices. So in one sense, there is little to tell. But that's a good thing. The total CPI did fall in September by 0.3%, seasonally adjusted, after a 0.3% increase in August. Over the last 12 months, the not seasonally adjusted index is up 1.2%, a noticeable slowing from August's 1.9%. Similarly, Germany's data, which came out yesterday, had a 0.1% decline in September and a 12-month increase of just 1.0% after 1.7% in August.
We see from the table that in France the subset excluding energy is marginally firmer for the 12 months, up 1.3%, indicating that weaker energy lowered the total by 0.1% in September; that contribution in August was a +0.5%, so the latest is a significant turnaround. Energy prices themselves dropped 2.6% in the month alone and oil products, 4.3%.
This helped reduce other line items, of course. Transportation costs were up a mere 0.6% from a year earlier after a 3.5% advance in August, while housing -- which includes utilities in the French layout -- was up 3.8% in September from a year ago, much less than August's 4.7%.
Prices of some things remain troublesome, most notably food. Food prices, in France and elsewhere, have been picking up. The 12-month rise was 2.7% in September, following 2.4% in August and just 0.8% across 2005. The same is true in Estonia, where the category was up 7.5% in September from a year ago and in Slovenia where it was up 3.8% in September and 4.7% in August compared with 0.8% over 2005. Among the larger economies, in Germany, food was up 3.1% in September; it had also risen just 0.8% during 2005.
So we seem to face a rolling-kind of inflation evolution. The total inflation rate in several countries is remaining remarkably calm, but relative prices are all over the board. This is healthy. Some sector is always "troublesome" and that keeps people, merchants and policymakers vigilant. But economies are increasingly flexible, so that the trouble in one area is met with adjustment elsewhere instead of just battering its way through everything. We hope this situation holds; it will be good for the general welfare if it does.
| France CPI, % Changes, NSA ex as Noted | Month/Month Year/Year December/December|||||||
|---|---|---|---|---|---|---|---|
| Sept 2006 | Aug 2006 | Sept 2006 | Aug 2006 | 2005 | 2004 | 2003 | |
| All Items, SA | -0.3 | 0.3 | -- | -- | -- | -- | -- |
| All Items | -0.2 | 0.3 | 1.2 | 1.9 | 1.5 | 2.1 | 2.2 |
| Ex Energy | 0.0 | 0.3 | 1.3 | 1.4 | 1.1 | 1.5 | 2.4 |
| Energy | -2.6 | 0.6 | 1.0 | 7.2 | 8.2 | 10.2 | -0.1 |
| Oil Products | -4.3 | 0.6 | -2.1 | 7.2 | 11.1 | 16.4 | -0.5 |
| Transportation | -1.8 | 0.3 | 0.6 | 3.5 | 3.7 | 4.5 | 1.9 |
| Housing | 0.0 | 0.4 | 3.8 | 4.7 | 4.4 | 4.5 | 2.1 |
| Food | 0.4 | -0.5 | 2.7 | 2.4 | 0.8 | 0.0 | 2.4 |

Tom Moeller
AuthorMore in Author Profile »Prior to joining Haver Analytics in 2000, Mr. Moeller worked as the Economist at Chancellor Capital Management from 1985 to 1999. There, he developed comprehensive economic forecasts and interpreted economic data for equity and fixed income portfolio managers. Also at Chancellor, Mr. Moeller worked as an equity analyst and was responsible for researching and rating companies in the economically sensitive automobile and housing industries for investment in Chancellor’s equity portfolio. Prior to joining Chancellor, Mr. Moeller was an Economist at Citibank from 1979 to 1984. He also analyzed pricing behavior in the metals industry for the Council on Wage and Price Stability in Washington, D.C. In 1999, Mr. Moeller received the award for most accurate forecast from the Forecasters' Club of New York. From 1990 to 1992 he was President of the New York Association for Business Economists. Mr. Moeller earned an M.B.A. in Finance from Fordham University, where he graduated in 1987. He holds a Bachelor of Arts in Economics from George Washington University.
More Economy in Brief


