 Global| Aug 02 2005
June Growth in U.S. Personal Income Firm
by:Tom Moeller
|in:Economy in Brief
Summary
June personal income rose 0.5% following an unrevised 0.2% gain in May. Consensus expectations had been for a 0.4% increase. The strength in the total's rise owed to a 2.0% (6.1% y/y) increase in proprietors' income. Higher receipts [...]
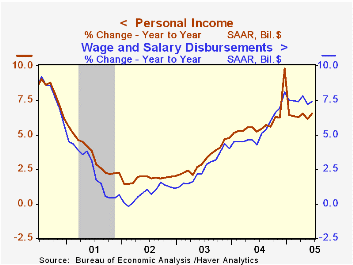
June personal income rose 0.5% following an unrevised 0.2% gain in May. Consensus expectations had been for a 0.4% increase. The strength in the total's rise owed to a 2.0% (6.1% y/y) increase in proprietors' income.
Higher receipts from assets also lifted earnings last month as interest income rose 1.5% (4.3% y/y) and dividend income rose 0.8% (9.5% y/y).
Wages & salaries rose a modest 0.2% (7.4% y/y) following a slim 0.1% gain in May. Factory sector wages fell 0.2% (5.7% y/y) though service sector wages rebounded 0.3% (8.8% y/y) following no change the prior month.
Disposable personal income jumped 0.5% (5.3% y/y) following a 0.2% increase in May. Adjusted for price inflation take home pay rose 0.5% (2.9% y/y) though upward revisions to pricing lowered slightly recent y/y gains.
Matching Consensus expectations, personal consumption expenditures surged 0.8% on the strength of higher sales of light vehicles. Spending on durables overall reversed the May decline with a 2.9% (8.0% y/y) increase. Nondurables spending rose a moderate 0.7% (7.3% y/y) and spending on services increased 0.5% (6.2% y/y).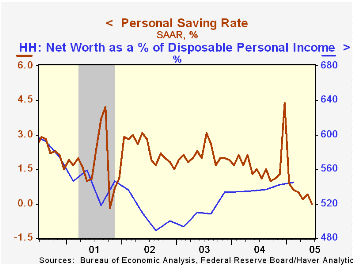
The personal savings rate fell to 0.0% though the household sector's net worth (from the Flow of Funds Accounts) has been rising, helped by a 16% increase in owners' equity in real estate.
The PCE chain price index fell slightly due to a 0.3% decline in gasoline prices which subsequently rose 6.2% in July. In August, gas prices are about equal to the prior month's average of $2.29. Less food & energy, prices also were unchanged as durable goods prices fell 0.4% (-0.5% y/y) and services prices increased a moderate 0.2% (2.9% y/y).
Closing the Gap from the Federal Reserve Bank of St. Louis is available here.
| Disposition of Personal Income | June | May | Y/Y | 2004 | 2003 | 2002 |
|---|---|---|---|---|---|---|
| Personal Income | 0.5% | 0.2% | 6.6% | 5.9% | 3.2% | 1.8% |
| Personal Consumption | 0.8% | -0.0% | 6.7% | 6.5% | 4.9% | 4.2% |
| Savings Rate | 0.0% | 0.4% | 1.5% | 1.7% | 2.1% | 2.4% |
| PCE Chain Price Index | -0.0% | 0.0% | 2.2% | 2.6% | 1.9% | 1.4% |
| Less food & energy | 0.0% | 0.2% | 1.9% | 2.0% | 1.3% | 1.8% |
by Tom Moeller August 2, 2005
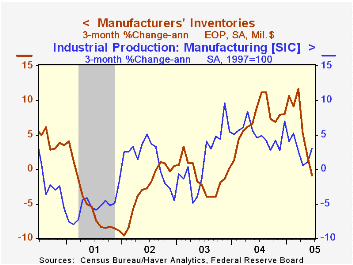
Factory inventories fell in June, down modestly for the third consecutive month. Three month growth in inventories fell to -0.9% (AR) versus the peak rate of accumulation near 12% in March and 7.5% growth last year. The slowdown accounts for much of this year's slowdown in factory output growth.
Slower rates of inventory accumulation continue notable in the primary metals industry where three month growth fell to 0.5% versus the high of 42.2% and in the electrical equipment industry where growth in inventories fell to 1.8% versus an 18.5% peak. The level of computer inventories has been declining this year versus a peak growth rate of 13% last summer.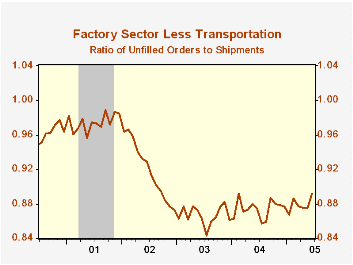
Factory shipments fell slightly in June and three month growth fell to 3.7% versus the high above 20% early last year.
Orders to the factory sector jumped 1.0% and the rise in durable goods orders was revised up to 2.0% from the advance report of a 1.4% gain.
Unfilled orders surged another 2.8% as backlogs of aircraft & parts jumped 5.8% (30.2% y/y). Less transportation altogether backlogs rose 1.9% (9.5% y/y) boosted by a 2.5% (14.8% y/y) gain in machinery. The ratio of unfilled orders to shipments outside of transportation jumped the highest level since 2002.
| Factory Survey (NAICS) | June | May | Y/Y | 2004 | 2003 | 2002 |
|---|---|---|---|---|---|---|
| Inventories | -0.0% | -0.2% | 6.4% | 7.5% | -1.3% | -1.8% |
| New Orders | 1.0% | 3.6% | 9.8% | 10.9% | 3.7% | -1.9% |
| Shipments | -0.1% | 0.3% | 6.2% | 10.5% | 2.6% | -2.0% |
| Unfilled Orders | 2.8% | 2.1% | 10.1% | 9.1% | 4.2% | -6.1% |
by Tom Moeller August 2, 2005
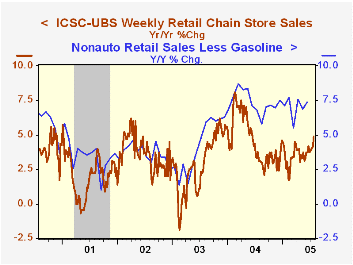
Chain store sales jumped 0.9% during the final week of July according to the International Council of Shopping Centers (ICSC)-UBS survey. This fifth consecutive gain lifted sales in July 0.4% higher than during June when sales fell 0.4% versus May.
During the last ten years there has been a 56% correlation between the y/y change in chain store sales and the change in non-auto retail sales less gasoline, as published by the US Census Department. Chain store sales correspond directly with roughly 14% of non-auto retail sales less gasoline.
The leading indicator of chain store sales from ICSC was unchanged (0.3% y/y).
The ICSC-UBS retail chain-store sales index is constructed using the same-store sales (stores open for one year) reported by 78 stores of seven retailers: Dayton Hudson, Federated, Kmart, May, J.C. Penney, Sears and Wal-Mart.
| ICSC-UBS (SA, 1977=100) | 07/30/05 | 07/23/05 | Y/Y | 2004 | 2003 | 2002 |
|---|---|---|---|---|---|---|
| Total Weekly Chain Store Sales | 462.8 | 456.9 | 4.9% | 4.6% | 2.9% | 3.6% |
by Louise Curley August 2, 2005
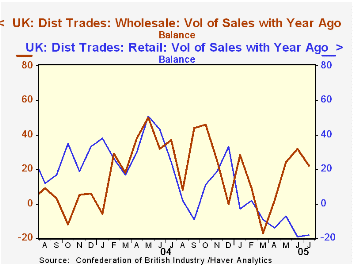
The results of the CBI (Confederation of British Industries) survey of the distributive trades released today show that the balance of opinion on the volume of retail sales improved minimally in July to -18 from -19 in June, the lowest figure since the survey began in 1983. Expectations of the volume of retail sales have caught up with the reported volumes and suggest that August will once again show only a minimal improvement to a balance of -17. The balance of reported sales volume for the retail sector has shown only one modest positive number--2 in February--since the beginning of the year.
There was more positive news for wholesale trade as can be seen in the first chart which shows the balance on reported sales volume for retail and wholesale trade. Although the balance on reported wholesale trade sales volume declined to 22 from 32 in June, the balance is significantly positive. Expected sales volume for August, however, are down to a positive 10. The balance on reported motor trade sales volume has been positive since May, but decreasing and the expected balance for August is once again negative at -4.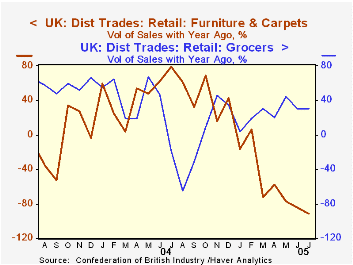
Balances of opinions on the annual growth of sales volume are also reported. In the most recent survey, Grocers showed the most positive results and Furniture and Carpet stores, the most dismal, as seen in the second chart.
The CBI Distributive Trades survey covers 20,000 outlets of firms responsible for 40% of employment in retailing. The most recent survey was conducted between June 29 and July 20, 2005 and included 125 responses.
| CBI Distributive Trade Survey | Aug 05 | July 05 | Jun 05 | May 05 | April 05 | Mar 05 | Feb 05 | Jan 05 |
|---|---|---|---|---|---|---|---|---|
| Retail Trade Sales Volume | ||||||||
| Expected | -17 | -18 | 5 | 1 | 3 | 14 | 7 | 8 |
| Reported | -18 | -19 | -7 | -14 | -9 | 2 | -3 | |
| Wholesale Trade Sales Volume | ||||||||
| Expected | 10 | 25 | 23 | 16 | -7 | -4 | 15 | 6 |
| Reported | 22 | 32 | 24 | 2 | -17 | 9 | 28 | |
| Motor Trade Sales Volume | ||||||||
| Expected | -4 | 2 | 7 | 6 | -5 | 4 | 7 | -4 |
| Reported | 3 | 7 | 8 | -7 | -16 | 2 | -9 | |
| Growth in Annual Sales Volume--Reported | ||||||||
| Grocers | 21 | 31 | 77 | 20 | 31 | 19 | 4 | |
| Furniture and Carpets | -92 | -84 | -77 | -58 | -72 | 6 | -16 |

Tom Moeller
AuthorMore in Author Profile »Prior to joining Haver Analytics in 2000, Mr. Moeller worked as the Economist at Chancellor Capital Management from 1985 to 1999. There, he developed comprehensive economic forecasts and interpreted economic data for equity and fixed income portfolio managers. Also at Chancellor, Mr. Moeller worked as an equity analyst and was responsible for researching and rating companies in the economically sensitive automobile and housing industries for investment in Chancellor’s equity portfolio. Prior to joining Chancellor, Mr. Moeller was an Economist at Citibank from 1979 to 1984. He also analyzed pricing behavior in the metals industry for the Council on Wage and Price Stability in Washington, D.C. In 1999, Mr. Moeller received the award for most accurate forecast from the Forecasters' Club of New York. From 1990 to 1992 he was President of the New York Association for Business Economists. Mr. Moeller earned an M.B.A. in Finance from Fordham University, where he graduated in 1987. He holds a Bachelor of Arts in Economics from George Washington University.
More Economy in Brief


