 Global| Aug 04 2004
July U.S. Light Vehicle Sales Rebounded
by:Tom Moeller
|in:Economy in Brief
Summary
Unit sales of light vehicles bounded back last month. The 12.0% m/m gain to a 17.30M selling rate did not, however, fully recoup the 13.4% decline in June. Consensus expectations had been for sales of 16.7M. The three month moving [...]
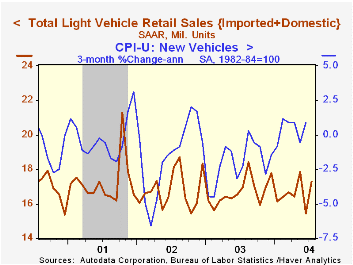
Unit sales of light vehicles bounded back last month. The 12.0% m/m gain to a 17.30M selling rate did not, however, fully recoup the 13.4% decline in June. Consensus expectations had been for sales of 16.7M.
The three month moving average of light vehicle sales improved to 16.86M, up 5.4% versus a low early last year. Pricing has firmed somewhat with that improvement. The CPI for new vehicles has risen at a 0.9% rate during the last three months versus a 4.5% rate of decline in early 2003.
Improved sales of light trucks led last month's rebound with a 17.3% m/m rise which recovered about all of the prior month's steep decline. Auto sales also rose but by a lesser 5.7% m/m which gained back about half of the June skid.
The strength in truck sales raised sales of domestic light vehicles by 15.6% to 14.02M (+2.5% y/y). Imported vehicle sales fell 1.0% m/m, the third decline in the last four months. (US sales of light trucks totaled 7.84M last year while imported truck sales totaled 1.20M.)
Imports' share of the US market for new vehicles in July dropped to 19.0% versus 19.7% last year.
| Light Vehicle Sales (SAAR, Mil.Units) | July | June | Y/Y | 2003 | 2002 | 2001 |
|---|---|---|---|---|---|---|
| Total | 17.30 | 15.44 | 2.0% | 16.69 | 16.81 | 17.26 |
| Autos | 7.48 | 7.08 | -1.9% | 7.63 | 8.07 | 8.48 |
| Trucks | 9.81 | 8.37 | 5.3% | 9.06 | 8.74 | 8.78 |
by Tom Moeller August 4, 2004
The Institute for Supply Management reported that its Business Activity Index for the non-manufacturing sector rose last month to 64.8 versus 59.9 in June. Consensus expectations had been for a lesser rise to 62.0.
Since the series' inception in 1997 there has been a 60% correlation between the Business Activity Index and the q/q change in GDP services plus construction.
The new orders index jumped to a record high of 66.4, up 4.0 points from June and up 8.3 points from the 2003 average.
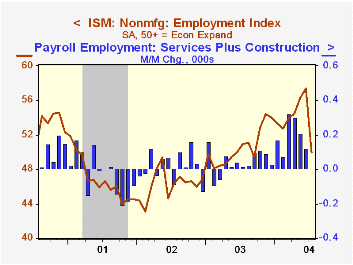
The employment index fell a sharp 7.4 points from the June record to the lowest level since last September. Nevertheless, higher employment was reported by 18% of firms, down from 27% in June but up versus 17% last year.
Since the series' inception in 1997 there has been a 60% correlation between the level of the ISM non-manufacturing employment index and the m/m change in payroll employment in the service producing and construction industries.Business activity for the non-manufacturing sector is a question separate from the subgroups mentioned above. In contrast, the NAPM manufacturing sector composite index is a weighted average five components.
The seasonally adjusted prices index slipped to 73.1 from the record high in June.
ISM surveys more than 370 purchasing managers in more than 62 industries including construction, law firms, hospitals, government and retailers. The non-manufacturing survey dates only to July 1997, therefore its seasonal adjustment should be viewed tentatively.
| ISM Non-manufacturing Survey | July | June | July '03 | 2003 | 2002 | 2001 |
|---|---|---|---|---|---|---|
| Business Activity Index | 64.8 | 59.9 | 64.1 | 58.1 | 55.1 | 48.9 |
| Prices Index | 73.1 | 74.6 | 52.6 | 56.7 | 53.9 | 51.5 |
by Tom Moeller August 4, 2004
Factory inventories jumped 0.7% in June following a like, upwardly revised gain in May. The gain was seventh successive month of accumulation.
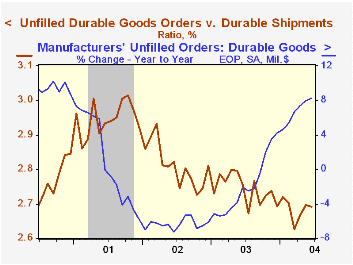
Unfilled orders also rose, up a strong 0.6% and 8.2% y/y. The gain did not, however, represent much of a bottleneck problem. The ratio of unfilled orders to shipments rose versus the low of last March but remained well below the highs of 2001.
Factory orders rose 0.7% following an upwardly revised 0.4% May gain. Durable goods orders jumped 0.9% versus the advance report of a 0.7% rise.Non-durable goods orders (which equal shipments) rose 0.5% (12.7% y/y) after an upwardly revised 2.0% gain in May.
Factory shipments rose 0.7%. Excluding the transportation sector shipments rose 0.6% for the second consecutive month (12.7% y/y).
| Factory Survey (NAICS) | June | May | Y/Y | 2003 | 2002 | 2001 |
|---|---|---|---|---|---|---|
| Inventories | 0.7% | 0.7% | 2.3% | -1.3% | -1.8% | -6.1% |
| New Orders | 0.7% | 0.4% | 12.1% | 3.7% | -1.9% | -6.7% |
| Shipments | 0.7% | 0.6% | 11.7% | 2.6% | -2.0% | -5.4% |
| Unfilled Orders | 0.6% | 0.6% | 8.2% | 4.2% | -6.1% | -5.9% |
by Tom Moeller August 4, 2004
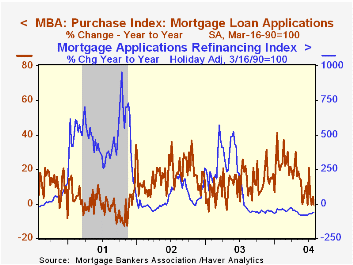
The index of mortgage applications compiled by the Mortgage Bankers Association slipped 0.2% last week after rising 0.6% the prior week. Applications in July rose 8.8% versus June.
Purchase applications rose 1.6% following the 1.0% gain the prior week. The July average was 4.2% higher than June.
During the last ten years there has been a 63% correlation between the y/y change in purchase applications and the change in new plus existing home sales.
Applications to refinance mortgages fell 2.9%, down for the fourth straight week. Refi's in July were 17.3% ahead of June.
The effective interest rate on a conventional 30-Year mortgage was about stable at 6.26% and 6.24% in July. The effective rate on a 15-year mortgage also was about stable at 5.71%.
The Mortgage Bankers Association surveys between 20 to 35 of the top lenders in the U.S. housing industry to derive its refinance, purchase and market indexes. The weekly survey accounts for more than 40% of all applications processed each week by mortgage lenders. Visit the Mortgage Bankers Association site here.
| MBA Mortgage Applications (3/16/90=100) | 07/30/04 | 07/23/04 | Y/Y | 2003 | 2002 | 2001 |
|---|---|---|---|---|---|---|
| Total Market Index | 620.4 | 621.9 | -36.9% | 1,067.9 | 799.7 | 625.6 |
| Purchase | 452.0 | 444.8 | -1.0% | 395.1 | 354.7 | 304.9 |
| Refinancing | 1,600.3 | 1,648.8 | -60.5% | 4,981.8 | 3,388.0 | 2,491.0 |

Tom Moeller
AuthorMore in Author Profile »Prior to joining Haver Analytics in 2000, Mr. Moeller worked as the Economist at Chancellor Capital Management from 1985 to 1999. There, he developed comprehensive economic forecasts and interpreted economic data for equity and fixed income portfolio managers. Also at Chancellor, Mr. Moeller worked as an equity analyst and was responsible for researching and rating companies in the economically sensitive automobile and housing industries for investment in Chancellor’s equity portfolio. Prior to joining Chancellor, Mr. Moeller was an Economist at Citibank from 1979 to 1984. He also analyzed pricing behavior in the metals industry for the Council on Wage and Price Stability in Washington, D.C. In 1999, Mr. Moeller received the award for most accurate forecast from the Forecasters' Club of New York. From 1990 to 1992 he was President of the New York Association for Business Economists. Mr. Moeller earned an M.B.A. in Finance from Fordham University, where he graduated in 1987. He holds a Bachelor of Arts in Economics from George Washington University.
More Economy in Brief


