 Global| Feb 27 2007
January Durable Goods Orders Fall, Giving Up Late 2006 Gains
Summary
New orders for durable goods dropped 7.8% in January, following a downwardly revised 2.8% gain in December (originally 3.1%). Consensus expectations called for about a 3% fall, which would have basically reversed the December [...]
New orders for durable goods dropped 7.8% in January, following a downwardly revised 2.8% gain in December (originally 3.1%). Consensus expectations called for about a 3% fall, which would have basically reversed the December increase.
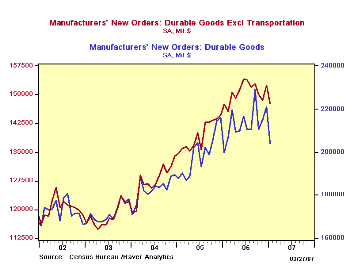
The drop was spread across several of the categories included in this "advance" report. The largest was in aircraft, both nondefense and defense. These had been up sharply in both November and December, so the decline now would not have been surprising. Motor vehicles, similarly, had been up three months running, and the January decrease, 5.1%, offset almost exactly their December rise of 5.3%. Total orders less transportation equipment were off 3.1% after December's 2.3% increase. Looking at the accompanying graph, we can't help but notice the developing downtrend in this series; at $147.7 billion in January, these orders are 4.2% below their peak last June. This comparison is less meaningful for total orders, since they swing so widely from month to month.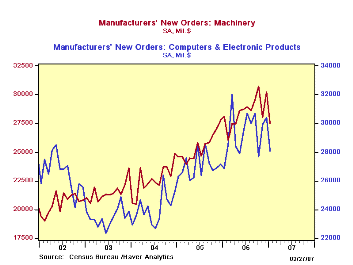
Nondefense capital goods excluding aircraft also fell, by 6.0%. This included machinery, computers and communications equipment. Correspondingly, orders for primary metals were down, although those for fabricated metal products rose. The other sector with an increase was electrical equipment, appliances and components. Also, despite the fall in orders for defense aircraft and parts, those for total defense capital goods were up 10.7%.
Durable goods shipments continued their recent pattern of modest monthly increases, rising 0.2%, after 0.5% in December and 0.3% in November. Excluding transportation, shipments were up 0.9%, after declines of 0.4% and 0.3%, respectively in the two preceding months.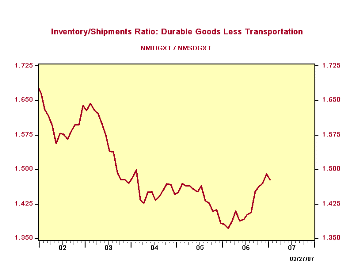
Inventories rose 0.3% but were unchanged less transportation equipment. The inventory/shipments ratio was up ever so slightly from 1.407 to 1.408, while excluding transportation, it went down from 1.490 to 1.477. These latest values compare [unfavorably] with annual averages in 2006 of 1.356 for total durables and 1.417 excluding transportation.
| Durable Goods, SA, % Chg |
Jan 2007 | Dec 2006 | Nov 2006 | Yr/Yr | 2006 | 2005 | 2004 |
|---|---|---|---|---|---|---|---|
| Total | -7.8 | 2.8 | 2.2 | 2.1 | 7.1 | 9.0 | 6.4 |
| Ex Transportation | -3.1 | 2.3 | -0.9 | 0.2 | 8.1 | 9.4 | 7.6 |
| Nondefense Capital Goods | -19.9 | 10.5 | -0.3 | -0.5 | 9.8 | 21.4 | 5.6 |
| Ex Aircraft | -6.0 | 3.6 | -1.0 | -0.6 | 9.3 | 12.3 | 2.8 |
Carol Stone, CBE
AuthorMore in Author Profile »Carol Stone, CBE came to Haver Analytics in 2003 following more than 35 years as a financial market economist at major Wall Street financial institutions, most especially Merrill Lynch and Nomura Securities. She had broad experience in analysis and forecasting of flow-of-funds accounts, the federal budget and Federal Reserve operations. At Nomura Securities, among other duties, she developed various indicator forecasting tools and edited a daily global publication produced in London and New York for readers in Tokyo. At Haver Analytics, Carol was a member of the Research Department, aiding database managers with research and documentation efforts, as well as posting commentary on select economic reports. In addition, she conducted Ways-of-the-World, a blog on economic issues for an Episcopal-Church-affiliated website, The Geranium Farm. During her career, Carol served as an officer of the Money Marketeers and the Downtown Economists Club. She had a PhD from NYU's Stern School of Business. She lived in Brooklyn, New York, and had a weekend home on Long Island.
More Economy in Brief


