 Global| Feb 02 2009
ISM Index Improved Slightly From Historic Low
by:Tom Moeller
|in:Economy in Brief
Summary
The Institute for Supply Management (ISM) reported that its January Composite Index of Activity in the manufacturing sector improved slightly to 35.6 from it's December low of 32.4. The latest was still near the lowest level since the [...]
The Institute for Supply Management (ISM) reported that its January Composite Index of Activity in the manufacturing sector improved slightly to 35.6 from it's December low of 32.4. The latest was still near the lowest level since the recession year of 1980. The break-even level for this diffusion index of factory sector activity is a level of 50.you
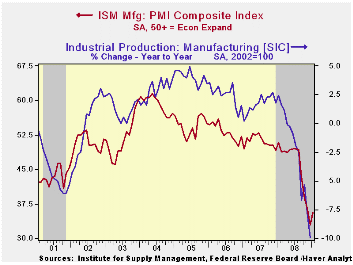
During the last twenty years there has been a 64% correlation between the level of the Composite Index and the three-month growth in factory sector industrial production.
It is appropriate to correlate the ISM index level with factory sector growth because the ISM index is a diffusion index. It measures growth by using all of the positive changes in activity added to one half of the zero change in activity measures.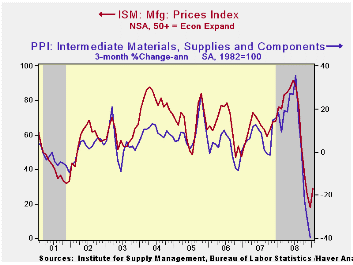
The separate index of prices paid also improved moderately to 29.0. That, however, was not much above the lowest level since 1949. During the last twenty years there has been a 79% correlation between the price index and the three-month change in the PPI for intermediate goods.
The latest increase in the composite index recouped only a bit of the declines during the prior five months. That suggests the recent 10% rate of decline in industrial output will continue.
The new orders index during January improved slightly as 15% of survey participants reported higher orders but 52% reported that orders fell. The export order index improved, but only at the margin as economic weakness outside of the U.S. continued. It was still near the lowest level in this index's short twenty year history. During the last ten years there has been a 53% correlation between the index and the q/q change in real exports of goods in the GDP accounts.
| ISM Mfg | January | December | January '08 | 2008 | 2007 | 2006 |
|---|---|---|---|---|---|---|
| Composite Index | 35.6 | 32.9 | 50.8 | 45.5 | 51.1 | 53.1 |
| New Orders Index | 33.2 | 23.1 | 48.9 | 42.1 | 54.3 | 55.4 |
| Employment Index | 29.9 | 29.9 | 47.9 | 43.2 | 50.5 | 51.7 |
| Prices Paid Index (NSA) | 29.0 | 18.0 | 76.0 | 66.5 | 64.6 | 65.0 |

Tom Moeller
AuthorMore in Author Profile »Prior to joining Haver Analytics in 2000, Mr. Moeller worked as the Economist at Chancellor Capital Management from 1985 to 1999. There, he developed comprehensive economic forecasts and interpreted economic data for equity and fixed income portfolio managers. Also at Chancellor, Mr. Moeller worked as an equity analyst and was responsible for researching and rating companies in the economically sensitive automobile and housing industries for investment in Chancellor’s equity portfolio. Prior to joining Chancellor, Mr. Moeller was an Economist at Citibank from 1979 to 1984. He also analyzed pricing behavior in the metals industry for the Council on Wage and Price Stability in Washington, D.C. In 1999, Mr. Moeller received the award for most accurate forecast from the Forecasters' Club of New York. From 1990 to 1992 he was President of the New York Association for Business Economists. Mr. Moeller earned an M.B.A. in Finance from Fordham University, where he graduated in 1987. He holds a Bachelor of Arts in Economics from George Washington University.
More Economy in Brief


