 Global| Aug 02 2004
ISM Factory Index Recovered in July
by:Tom Moeller
|in:Economy in Brief
Summary
The Purchasing Managers Composite Index (PMI) for July, released by the Institute of Supply Management, rose to 62.0. The figure recovered most of the prior month's decline to 61.1 from 62.8 in May and matched Consensus expectations [...]
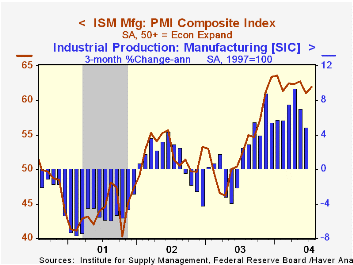
The Purchasing Managers’ Composite Index (PMI) for July, released by the Institute of Supply Management, rose to 62.0. The figure recovered most of the prior month's decline to 61.1 from 62.8 in May and matched Consensus expectations for a reading of 62.0.
During the last twenty years there has been a 70% correlation between the level of the Composite Index and the three month growth in factory sector industrial production.
Improvement in production (66.1) and new orders (64.7) led the composite index higher though the separate index of export orders fell for the fourth consecutive month.
These gains were offset by a decline in the employment index (57.3) to the lowest level since March. The vendor deliveries (64.2) and the inventories (49.9) indexes also fell.
The prices paid index eased for the third straight month to the lowest level since January.
| ISM Manufacturing Survey | July | June | July '03 | 2003 | 2002 | 2001 |
|---|---|---|---|---|---|---|
| Composite Index | 62.0 | 61.1 | 52.6 | 53.3 | 52.4 | 43.9 |
| New Orders Index | 64.7 | 60.0 | 57.6 | 58.1 | 56.6 | 46.1 |
| Prices Paid Index (NSA) | 77.0 | 81.0 | 53.0 | 59.6 | 57.6 | 42.9 |
by Tom Moeller August 2, 2004
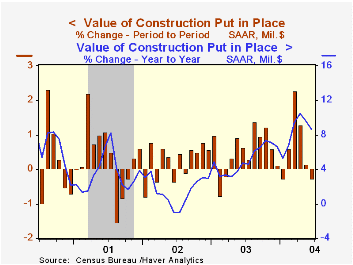
The total value of construction put in place dipped 0.3% in June following a modest 0.1% May uptick. No change in June spending had been the Consensus expectation.
Private residential building activity fell 0.4% after a mild 0.3% rise in May. Residential building dropped 0.6% (+13.3% y/y) as new single family building fell 0.3% (+21.6% y/y) following three months of very sharp gain.
Nonresidential building was unchanged (+3.2% y/y) after a sharp 1.0% decline in May. Health care (+11.7% y/y) and education (-6.1% y/y) spending slipped.
Public construction ticked 0.2% higher (+4.2% y/y) but spending on highways & streets, which is nearly one third of the value of public construction spending, dropped 3.9% m/m (+8.8% y/y).
These more detailed categories represent the Census Bureau’s reclassification of construction activity into end-use groups. Finer detail is available for many of the categories; for instance, commercial construction is shown for Automotive sales and parking facilities, drugstores, building supply stores, and both commercial warehouses and mini-storage facilities. Note that start dates vary for some seasonally adjusted line items in 2000 and 2002 and that constant-dollar data are no longer computed.
| Construction Put-in-place | June | May | Y/Y | 2003 | 2002 | 2001 |
|---|---|---|---|---|---|---|
| Total | 1.3% | 2.4% | 11.3% | 4.0% | 1.1% | 2.7% |
| Private | 1.2% | 1.1% | 11.6% | 4.6% | -0.2% | 1.4% |
| Residential | 1.2% | 1.3% | 17.3% | 10.1% | 8.6% | 3.3% |
| Nonresidential | 1.3% | 0.7% | 0.1% | -5.5% | -13.0% | -1.3% |
| Public | 1.7% | 7.0% | 10.2% | 2.1% | 5.3% | 7.4% |

Tom Moeller
AuthorMore in Author Profile »Prior to joining Haver Analytics in 2000, Mr. Moeller worked as the Economist at Chancellor Capital Management from 1985 to 1999. There, he developed comprehensive economic forecasts and interpreted economic data for equity and fixed income portfolio managers. Also at Chancellor, Mr. Moeller worked as an equity analyst and was responsible for researching and rating companies in the economically sensitive automobile and housing industries for investment in Chancellor’s equity portfolio. Prior to joining Chancellor, Mr. Moeller was an Economist at Citibank from 1979 to 1984. He also analyzed pricing behavior in the metals industry for the Council on Wage and Price Stability in Washington, D.C. In 1999, Mr. Moeller received the award for most accurate forecast from the Forecasters' Club of New York. From 1990 to 1992 he was President of the New York Association for Business Economists. Mr. Moeller earned an M.B.A. in Finance from Fordham University, where he graduated in 1987. He holds a Bachelor of Arts in Economics from George Washington University.
More Economy in Brief


