 Global| Jul 10 2003
Initial Jobless Insurance Claims Again Higher
by:Tom Moeller
|in:Economy in Brief
Summary
Initial claims for unemployment insurance rose unexpectedly by 5,000 last week, to 439,000, and added to a 26,000 increase the prior week that was revised up. Consensus expectations had been for claims of 420,000 The four-week moving [...]
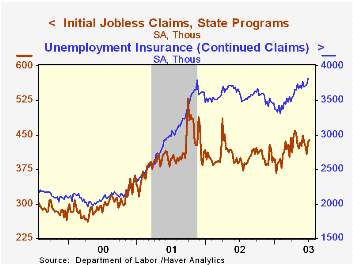
Initial claims for unemployment insurance rose unexpectedly by 5,000 last week, to 439,000, and added to a 26,000 increase the prior week that was revised up. Consensus expectations had been for claims of 420,000
The four-week moving average of initial claims rose to 426,750 (+8.2% y/y).
Continuing claims for unemployment insurance surged by 87,000 (2.3%) w/w. The prior week's level was revised down slightly.
During the last ten years there has been a 79% (inverse) correlation between the level of initial claims for unemployment insurance and the y/y change in nonfarm payrolls.
The insured rate of unemployment rose to 3.0% from a downwardly revised 2.9% the week prior.
| Unemployment Insurance (000s) | 7/2/03 | 6/28/03 | Y/Y | 2002 | 2001 | 2000 |
|---|---|---|---|---|---|---|
| Initial Claims | 439.0 | 434.0 | 9.7% | 404.3 | 406.0 | 299.7 |
| Continuing Claims | -- | 3,818 | 5.4% | 3,575 | 3,022 | 2,114 |
by Tom Moeller July 10, 2003
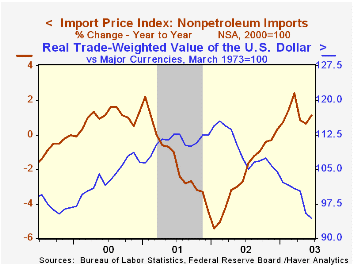
Prices for imported commodities rose more than expected last month. The 0.8% rise was double Consensus expectations. The 0.8% decline in prices in May was much deeper than the initial estimate of a 0.3% decline.
Petroleum import prices rose 4.7% last month and recovered most of a 5.4% May decline that was deepened sharply. So far in July the price of Brent Crude Oil has been around $28.00 versus $27.49/bbl averaged in June.
Nonpetroleum import prices rose 0.5%, the first increase in three months. The gain reflected increases in each of the categories. Nonauto consumer goods prices rose 0.2% (0.0% y/y) for the first gain this year. Prices for industrial supplies and materials jumped 2.6% (8.8% y/y).
Export prices fell 0.2% for the second decline in the last three months. Export prices for food and capital goods fell.
| Import/Export Prices (NSA) | June | May | Y/Y | 2002 | 2001 | 2000 |
|---|---|---|---|---|---|---|
| Import - All Commodities | 0.8% | -0.8% | 2.0% | -2.5% | -3.5% | 6.5% |
| Petroleum | 4.7% | -5.4% | 12.0% | 3.0% | -17.2% | 66.5% |
| Nonpetroleum | 0.5% | -0.3% | 1.1% | -2.4% | -1.5% | 1.0% |
| Export - All Commodities | -0.2% | 0.1% | 1.5% | -1.0% | -0.8% | 1.6% |

Tom Moeller
AuthorMore in Author Profile »Prior to joining Haver Analytics in 2000, Mr. Moeller worked as the Economist at Chancellor Capital Management from 1985 to 1999. There, he developed comprehensive economic forecasts and interpreted economic data for equity and fixed income portfolio managers. Also at Chancellor, Mr. Moeller worked as an equity analyst and was responsible for researching and rating companies in the economically sensitive automobile and housing industries for investment in Chancellor’s equity portfolio. Prior to joining Chancellor, Mr. Moeller was an Economist at Citibank from 1979 to 1984. He also analyzed pricing behavior in the metals industry for the Council on Wage and Price Stability in Washington, D.C. In 1999, Mr. Moeller received the award for most accurate forecast from the Forecasters' Club of New York. From 1990 to 1992 he was President of the New York Association for Business Economists. Mr. Moeller earned an M.B.A. in Finance from Fordham University, where he graduated in 1987. He holds a Bachelor of Arts in Economics from George Washington University.


