 Global| Nov 21 2002
Initial Claims for Unemployment Insurance Down
by:Tom Moeller
|in:Economy in Brief
Summary
Initial claims for unemployment insurance were lower than expected in the latest week at the lowest level in four months. Claims in the prior week were revised up slightly. The latest figure is for the survey period for November [...]

Initial claims for unemployment insurance were lower than expected in the latest week at the lowest level in four months. Claims in the prior week were revised up slightly.
The latest figure is for the survey period for November nonfarm payrolls. Initial claims were down 38,000 (9.2%) from the October survey period.
There has been a 65% correlation during the last ten years between the level of initial claims and the m/m change in nonfarm payrolls.
The four-week moving average of initial claims dropped to 395,750, down 10.3% y/y.
Continuing claims for unemployment insurance fell 1.7% w/w from the prior week's elevated level which was little revised.
The insured rate of unemployment fell slightly to 2.8%, back to the average of the last four months.
| Unemployment Insurance (000s) | 11/16/02 | 11/09/02 | Y/Y | 2001 | 2000 | 1999 |
|---|---|---|---|---|---|---|
| Initial Claims | 376.0 | 401.0 | -11.5% | 405.8 | 299.8 | 297.7 |
| Continuing Claims | -- | 3,582 | -2.0% | 3,021 | 2,114 | 2,186 |
by Tom Moeller November 21, 2002
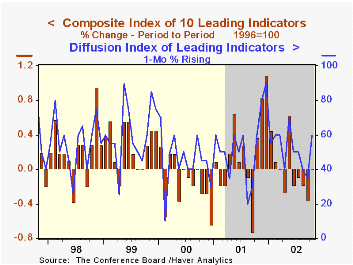
The Composite Index of Leading Economic Indicators, reported by the Conference Board, was unchanged last month, as expected. Prior months' declines were revised deeper.
The breadth-of-gain amongst the leaders' component series improved sharply to 60% from a downwardly revised level of 35% in September. The six-month diffusion index remained at a low 50%.
Lower claims for jobless insurance and a higher money supply had the largest positive influences on the leading index in October offset by lower consumer expectations and vendor deliveries and a shorter workweek.
The ratio of coincident-to-lagging indicators was unchanged. The ratio is an indicator of excess relative to actual economic performance.
The coincident indicators and the lagging indicators were unchanged.
The Leading index is based on eight previously reported economic data series and two that are estimated.
| Business Cycle Indicators | Oct | Sept | Y/Y | 2001 | 2000 | 1999 |
|---|---|---|---|---|---|---|
| Leading | 0.0% | -0.4% | 2.0% | -0.7% | 1.1% | 3.3% |
| Coincident | 0.0% | 0.0% | 0.7% | -0.5% | 3.4% | 3.2% |
| Lagging | 0.0% | -0.5% | -3.8% | -1.3% | 2.8% | 1.7% |
by Tom Moeller November 21, 2002
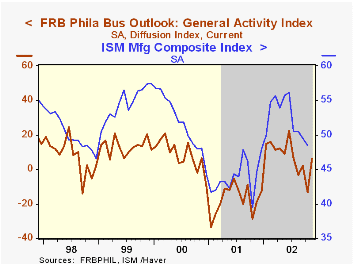
The Philadelphia Fed’s index of general business conditions for November improved more than expected. The Business Activity Index rose to 6.1, the highest level since July. A reading of -5.0 had been expected.
The improvement mirrored the rise reported last week in the Empire State General Conditions Index for November.
Amongst the sub indexes, new orders improved sharply and shipments turned positive versus their negative readings last month. Employment was virtually flat.
The business conditions index reflects a separate survey question, not the components.
The prices paid index fell moderately, but remained quite positive as it has since March.
During the last ten years there has been a 46% correlation between the level of the General Activity Index and the quarterly change in real GDP. Over the last twenty years that correlation has been 67%.
For a discussion of the Philadelphia Fed's Business Outlook Survey click here.
| Philadelphia Fed Business Outlook | Nov | Oct | Y/Y | 2001 | 2000 | 1999 |
|---|---|---|---|---|---|---|
| General Activity Index | 6.1 | -13.1 | -18.5 | -17.3 | 8.2 | 13.3 |
| Prices Paid Index | 13.0 | 14.3 | -17.6 | -1.0 | 27.1 | 10.0 |
by Tom Moeller November 21, 2002

The US budget deteriorated last month versus Consensus expectations for a $45 bil. deficit.
Receipts fell sharply m/m in payback for the 54.7% surge in September. Individual tax payments fell m/m and were down 13.0% from last year.
Federal expenditures surged m/m following a decline in September and were up 8.6% y/y. Defense spending was up 15.2% y/y. Spending on transportation and education also continued strong.
| US Government Finance | Oct | Sept | y/y | FY2002 | FY2001 | FY2000 |
|---|---|---|---|---|---|---|
| Budget Balance | $-54.0B | $42.5B | $-7.7B | $-158.5B | $127.1B | $125.5B |
| Revenues | $124.9B | $192.8B | -20.5% | -6.9% | -1.7% | 10.8% |
| Outlays | $178.9B | $150.3B | 8.6% | 7.9% | 4.2% | 5.1% |

Tom Moeller
AuthorMore in Author Profile »Prior to joining Haver Analytics in 2000, Mr. Moeller worked as the Economist at Chancellor Capital Management from 1985 to 1999. There, he developed comprehensive economic forecasts and interpreted economic data for equity and fixed income portfolio managers. Also at Chancellor, Mr. Moeller worked as an equity analyst and was responsible for researching and rating companies in the economically sensitive automobile and housing industries for investment in Chancellor’s equity portfolio. Prior to joining Chancellor, Mr. Moeller was an Economist at Citibank from 1979 to 1984. He also analyzed pricing behavior in the metals industry for the Council on Wage and Price Stability in Washington, D.C. In 1999, Mr. Moeller received the award for most accurate forecast from the Forecasters' Club of New York. From 1990 to 1992 he was President of the New York Association for Business Economists. Mr. Moeller earned an M.B.A. in Finance from Fordham University, where he graduated in 1987. He holds a Bachelor of Arts in Economics from George Washington University.
More Economy in Brief


