Global| Nov 20 2003
Initial Claims for Jobless Insurance Fell
by:Tom Moeller
|in:Economy in Brief
Summary
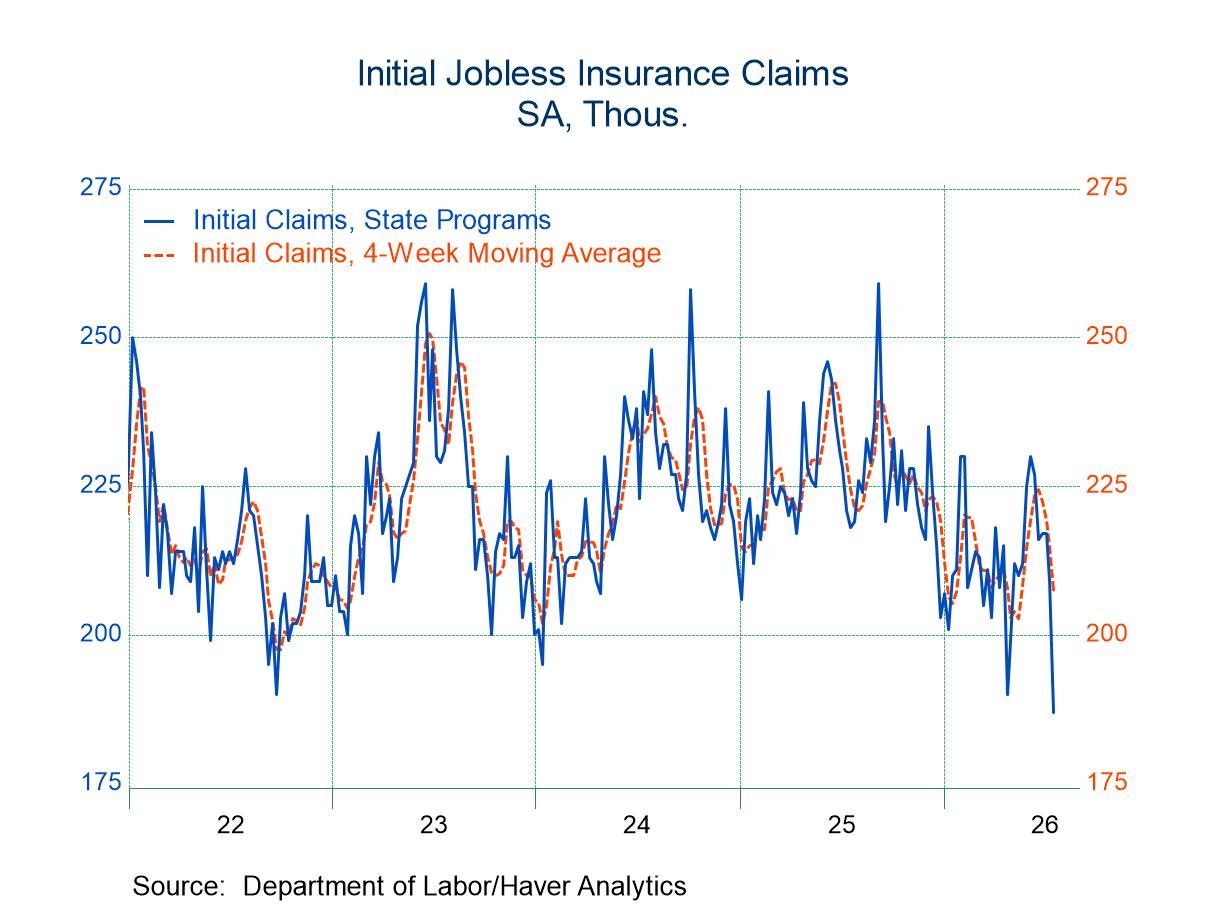
Initial claims for jobless insurance fell to 355,000 last week. Down 15,000 w/w and down 73,000 (17.1%) since early September, claims were near the lowest level since early 2001. Consensus expectations had been for claims of 365,000. [...]
Initial claims for jobless insurance fell to 355,000 last week. Down 15,000 w/w and down 73,000 (17.1%) since early September, claims were near the lowest level since early 2001. Consensus expectations had been for claims of 365,000.
The four-week moving average of initial claims fell to 367,250 (-8.0% y/y), the lowest level since February 2001.
Continuing claims for unemployment insurance rose 21,000 in the latest week but the prior week's gain was revised to 1,000 versus 49,000 reported initially. Continuing claims for unemployment insurance are down 7.5% from the peak in late June.
The insured rate of unemployment ticked up to 2.8% but the prior two weeks were revised down to 2.7%.
"Monetary Policy in Jobless Recoveries" from the Federal Reserve Bank of St. Louis is available here.
| Unemployment Insurance (000s) | 11/15 | 11/08 | Y/Y | 2002 | 2001 | 2000 |
|---|---|---|---|---|---|---|
| Initial Claims | 355.0 | 370.0 | -7.8% | 404.3 | 406.0 | 299.7 |
| Continuing Claims | -- | 3,497 | -2.2% | 3,575 | 3,022 | 2,114 |
by Tom Moeller November 20, 2003
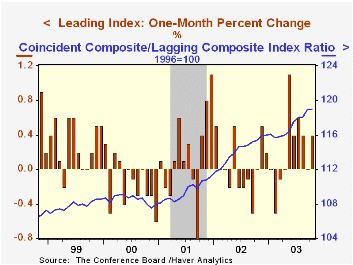
The Conference Board reported that the Composite Index of Leading Economic Indicators rose 0.4% in October following an upwardly revised no change in September. The rise was twice Consensus expectations for a 0.2% gain.
Gains amongst the leaders' component broadened to 60%. Over a six-month span, 85% of the leading series rose.
Fewer claims for jobless insurance, improved vendor performance, higher building permits and higher stock prices each contributed meaningfully to the October gain in the leading index.
The Leading index is based on eight previously reported economic data series and two that are estimated.
The coincident indicators posted a 0.2% gain for the second month. Year to date the coincident indicators are up 0.8% (AR). That YTD increase has been led by a 3.5% gain in real manufacturing & trade sales and a 2.0% gain in industrial production. Employment has fallen
The ratio of coincident-to-lagging indicators was unchanged. The ratio is an indicator of excess relative to actual economic performance.
Visit the Conference Board's site for coverage of leading indicator series from around the world.
"Should the Fed React to the Stock Market?" is a new report from the Federal Reserve Bank of San Francisco and it is available here.
| Business Cycle Indicators | Oct | Sept | Y/Y | 2002 | 2001 | 2000 |
|---|---|---|---|---|---|---|
| Leading | 0.4% | 0.0% | 2.9% | 2.1% | -0.9% | 1.0% |
| Coincident | 0.2% | 0.2% | 0.2% | -0.2% | -0.4% | 3.4% |
| Lagging | 0.2% | -0.6% | -2.4% | -4.4% | -1.3% | 2.8% |
by Tom Moeller November 20, 2003

The Chicago Fed National Activity Index (CFNAI) in October (0.01) remained positive for the third month in four.
A zero value of the CFNAI indicates that the economy is expanding at its historical trend rate of growth.
The three-month moving average of the CFNAI fell slightly to -0.07 from 0.06 the prior period.
The CFNAI is a weighted average of 85 indicators of economic activity. The indicators reflect activity in the following categories: production and income, the labor market, personal consumption and housing, manufacturing and trade sales, and inventories & orders.
For a complete discussion of the latest Chicago Fed's National Activity Index click here.
| Chicago Fed | Oct | Sept | Oct '02 | 2002 | 2001 | 2000 |
|---|---|---|---|---|---|---|
| CFNAI | 0.01 | 0.16 | -0.65 | -0.35 | -1.17 | -0.15 |
by Tom Moeller November 20, 2003

The Philadelphia Fed’s index of general business conditions in the manufacturing sector fell in November to 25.9 versus 28.0 in October. Consensus expectations were for a reading of 25.0.
The business conditions index remained near its highest level since July 1996.
During the last twenty years there has been a 64% correlation between the level of the Philadelphia Fed Business Conditions Index and quarterly growth in real GDP. The correlation with quarterly growth in factory sector industrial production has been 77%.
Amongst the sub indexes, new orders backpedaled from the October high to 20.8 versus 29.0. Shipments (26.8) also fell but only modestly. The employment index at 3.3 remained positive for the second consecutive month.
The business conditions index reflects a separate survey question, not the sub indexes.
A separate survey of expected business conditions in six months improved to 63.4, recovering most of the prior month's decline.
The prices paid index rose slightly to 24.9.
The Philadelphia Fed index is based on a survey of 250 regional manufacturing firms, but these firms sell nationally and internationally.
The latest Business Outlook survey from the Philadelphia Federal Reserve Bank can be foundhere.
| Philadelphia Fed Business Outlook | Nov | Oct | Nov '02 | 2002 | 2001 | 2000 |
|---|---|---|---|---|---|---|
| General Activity Index | 25.9 | 28.0 | 6.5 | 7.7 | -17.2 | 8.3 |
| Prices Paid Index | 24.9 | 22.3 | 16.6 | 12.2 | -0.9 | 27.2 |

Tom Moeller
AuthorMore in Author Profile »Prior to joining Haver Analytics in 2000, Mr. Moeller worked as the Economist at Chancellor Capital Management from 1985 to 1999. There, he developed comprehensive economic forecasts and interpreted economic data for equity and fixed income portfolio managers. Also at Chancellor, Mr. Moeller worked as an equity analyst and was responsible for researching and rating companies in the economically sensitive automobile and housing industries for investment in Chancellor’s equity portfolio. Prior to joining Chancellor, Mr. Moeller was an Economist at Citibank from 1979 to 1984. He also analyzed pricing behavior in the metals industry for the Council on Wage and Price Stability in Washington, D.C. In 1999, Mr. Moeller received the award for most accurate forecast from the Forecasters' Club of New York. From 1990 to 1992 he was President of the New York Association for Business Economists. Mr. Moeller earned an M.B.A. in Finance from Fordham University, where he graduated in 1987. He holds a Bachelor of Arts in Economics from George Washington University.
More Economy in Brief