 Global| Dec 18 2003
Initial Claims for Jobless Insurance Drop Sharply
by:Tom Moeller
|in:Economy in Brief
Summary
Initial claims for jobless insurance fell 22,000 (-5.9%) last week to 353,000. That followed an increase the prior week that was revised to 10,000 from 13,000 reported initially. Consensus expectations had been for claims of 370,000. [...]
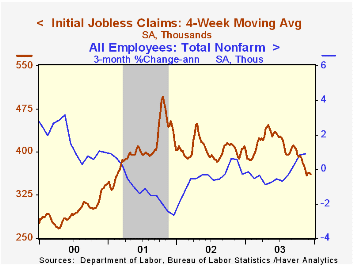
Initial claims for jobless insurance fell 22,000 (-5.9%) last week to 353,000. That followed an increase the prior week that was revised to 10,000 from 13,000 reported initially. Consensus expectations had been for claims of 370,000.
The latest claims figure covers the survey period for December non-farm payrolls. The level is down 9,000 (-2.5%) from the November period.
The four-week moving average of initial claims fell to 361,750 (-10.8% y/y).
Continuing claims for unemployment insurance rose 28,000 but the prior week was revised to a decline of 29,000 versus the 11,000 increase reported initially.
The insured rate of unemployment was unchanged at 2.6%.
| Unemployment Insurance (000s) | 12/13 | 12/06 | Y/Y | 2002 | 2001 | 2000 |
|---|---|---|---|---|---|---|
| Initial Claims | 353.0 | 375.0 | -16.2% | 404.3 | 406.0 | 299.7 |
| Continuing Claims | -- | 3,339 | -5.5% | 3,575 | 3,022 | 2,114 |
by Tom Moeller December 18, 2003
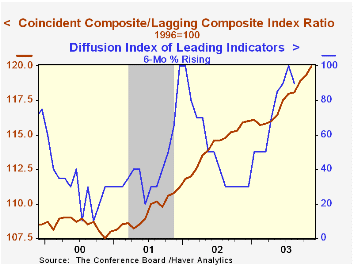
The Composite Index of Leading Economic Indicators reported by the Conference Board rose an expected 0.3% in November following an upwardly revised 0.5% October gain.
One month gains amongst the leaders' component dropped to 55% but over a six-month span all of the leading series increased.
Longer weekly hours worked, fewer claims for jobless insurance, improved vendor performance, and improved consumer expectations each contributed meaningfully to the November gain in the leading index.
The Leading index is based on eight previously reported economic data series and two that are estimated.
The coincident indicators rose for the sixth month in seven. Year to date the coincident indicators are up 1.0% (AR). That YTD increase has been led by a 3.3% gain in real manufacturing & trade sales and a 2.3% gain in industrial production. Employment is about unchanged and real income is up 1.3%.
The ratio of coincident-to-lagging indicators surged to a new record high and prior months were revised up. The ratio is an indicator of excess relative to actual economic performance.
Visit the Conference Board's site for coverage of leading indicator series from around the world.
| Business Cycle Indicators | Nov | Oct | Y/Y | 2002 | 2001 | 2000 |
|---|---|---|---|---|---|---|
| Leading | 0.3% | 0.5% | 2.9% | 2.1% | -0.9% | 1.0% |
| Coincident | 0.2% | 0.3% | 0.9% | -0.2% | -0.4% | 3.4% |
| Lagging | -0.3% | -0.1% | -2.5% | -4.4% | -1.3% | 2.8% |
by Tom Moeller December 18, 2003
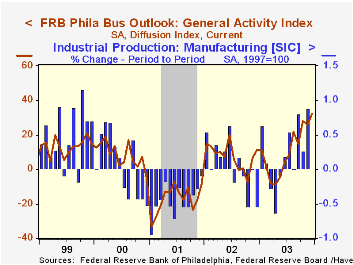
The Philadelphia Fed’s index of general business conditions in the manufacturing sector rose in December to 32.1 from 25.9 in November. Consensus expectations were for a slight decline to 25.0.
The latest reading is the highest since December 1993.
During the last twenty years there has been a 63% correlation between the level of the Philadelphia Fed Business Conditions Index and quarterly growth in real GDP. The correlation with quarterly growth in factory sector industrial production has been 76%.
Amongst the sub indexes, new orders boomed to 41.8, the highest level since 1973. Shipments (41.1) also surged to the ten year high. The employment index showed meaningful improvement to 21.9, also a thirty year high.
The business conditions index reflects a separate survey question, not the sub indexes.
A separate survey of expected business conditions in six months fell sharply to 52.3, the lowest level since May.
The prices paid index to its highest level since March 2000.
The Philadelphia Fed index is based on a survey of 250 regional manufacturing firms, but these firms sell nationally and internationally.
The latest Business Outlook survey from the Philadelphia Federal Reserve Bank can be found here.
| Philadelphia Fed Business Outlook | Dec | Nov | Dec '02 | 2003 | 2002 | 2001 |
|---|---|---|---|---|---|---|
| General Activity Index | 32.1 | 25.9 | 11.3 | 10.6 | 7.7 | -17.2 |
| Prices Paid Index | 31.4 | 24.9 | 17.7 | 16.8 | 12.2 | -0.9 |

Tom Moeller
AuthorMore in Author Profile »Prior to joining Haver Analytics in 2000, Mr. Moeller worked as the Economist at Chancellor Capital Management from 1985 to 1999. There, he developed comprehensive economic forecasts and interpreted economic data for equity and fixed income portfolio managers. Also at Chancellor, Mr. Moeller worked as an equity analyst and was responsible for researching and rating companies in the economically sensitive automobile and housing industries for investment in Chancellor’s equity portfolio. Prior to joining Chancellor, Mr. Moeller was an Economist at Citibank from 1979 to 1984. He also analyzed pricing behavior in the metals industry for the Council on Wage and Price Stability in Washington, D.C. In 1999, Mr. Moeller received the award for most accurate forecast from the Forecasters' Club of New York. From 1990 to 1992 he was President of the New York Association for Business Economists. Mr. Moeller earned an M.B.A. in Finance from Fordham University, where he graduated in 1987. He holds a Bachelor of Arts in Economics from George Washington University.
More Economy in Brief


