 Global| Feb 19 2004
Initial Claims for Jobless Insurance Down
by:Tom Moeller
|in:Economy in Brief
Summary
Initial claims for jobless insurance dropped 24,000 (-6.5%) to 344,000 last week. Consensus expectations had been for higher claims of 355,000. The prior week's level was revised up slightly. The latest figure is for the survey period [...]

Initial claims for jobless insurance dropped 24,000 (-6.5%) to 344,000 last week. Consensus expectations had been for higher claims of 355,000. The prior week's level was revised up slightly.
The latest figure is for the survey period for February non-farm payrolls and it is roughly unchanged from the January period. During the last ten years there has been a 79% (negative) correlation between the level of initial claims and the y/y change in non-farm payrolls.
The four-week moving average of initial claims was about unchanged at 352,000 (-10.7% y/y).
Continuing claims for unemployment insurance surged 106,000 w/w. The prior week's level was little revised.
The insured rate of unemployment ticked up w/w to 2.5%, the average level in January.
| Unemployment Insurance (000s) | 2/14/04 | 2/07/04 | Y/Y | 2003 | 2002 | 2001 |
|---|---|---|---|---|---|---|
| Initial Claims | 344.0 | 368.0 | -15.7% | 403 | 404 | 406 |
| Continuing Claims | -- | 3,186 | -7.1% | 3,535 | 3,575 | 3,022 |
by Tom Moeller February 19, 2004
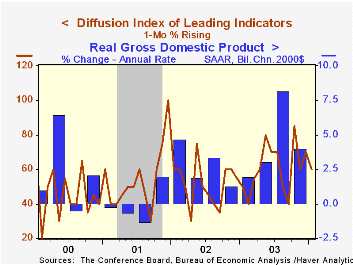
The Composite Index of Leading Economic Indicators reported by the Conference Board rose an expected 0.5% in January, the strongest monthly increase since October. December's 0.2% gain was unrevised.
One month gains amongst the leaders' component series eased slightly to 60% but over a six-month span 90% of the series rose.
Longer weekly hours worked, fewer claims for jobless insurance, higher stock prices, improved vendor performance and higher consumer expectations made large positive contributions to the January gain in the leading index. A lower money supply, a narrower yield curve and lower building permits had slight negative contributions.
The Leading index is based on eight previously reported economic data series and two that are estimated.
The coincident indicators rose with all of the four components up over one and six month spans.
The ratio of coincident-to-lagging indicators rose to another record level. The ratio is an indicator of excess relative to actual economic performance.
Visit the Conference Board's site for coverage of leading indicator series from around the world.
| Business Cycle Indicators | Jan | Dec | Y/Y | 2003 | 2002 | 2001 |
|---|---|---|---|---|---|---|
| Leading | 0.5% | 0.2% | 3.6% | 1.3% | 2.2% | -0.8% |
| Coincident | 0.3% | 0.0% | 1.2% | 0.4% | -0.5% | -0.5% |
| Lagging | 0.0% | -0.4% | -2.9% | -2.2% | -2.8% | -1.4% |
by Tom Moeller February 19, 2004
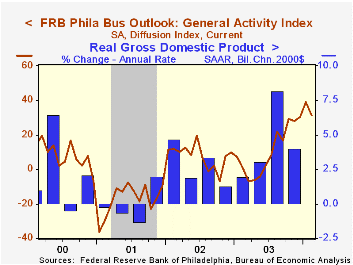
The Philadelphia Fed’s February index of general business conditions in the manufacturing sector fell to 31.4 in February from 38.8 last month. Consensus expectations had been for less of a decline to 35.0.
Despite the decline, the last three months' average of 33.5 is the highest since early 1984.
During the last twenty years there has been a 62% correlation between the level of the Philadelphia Fed Business Conditions Index and quarterly growth in real GDP. The correlation with quarterly growth in factory sector industrial production has been 76%.
Amongst the sub indexes, new orders fell to 27.5, the lowest level since November. Shipments (19.3) also dropped to the lowest level since September. The employment index fell to 12.5 but that level still is consistent with expanding factory sector employment.
The business conditions index reflects a separate survey question, not the sub indexes.
A separate survey of expected business conditions in six months dipped to 51.4, the lowest level since June.
The prices paid index surged 8.4 points to the highest level since February 1995.
The Philadelphia Fed index is based on a survey of 250 regional manufacturing firms, but these firms sell nationally and internationally.
The latest Business Outlook survey from the Philadelphia Federal Reserve Bank can be found here.
| Philadelphia Fed Business Outlook | Feb | Jan | Feb '03 | 2003 | 2002 | 2001 |
|---|---|---|---|---|---|---|
| General Activity Index | 31.4 | 38.8 | 0.7 | 10.6 | 7.7 | -17.2 |
| Prices Paid Index | 43.7 | 35.3 | 16.8 | 16.7 | 12.2 | -0.9 |

Tom Moeller
AuthorMore in Author Profile »Prior to joining Haver Analytics in 2000, Mr. Moeller worked as the Economist at Chancellor Capital Management from 1985 to 1999. There, he developed comprehensive economic forecasts and interpreted economic data for equity and fixed income portfolio managers. Also at Chancellor, Mr. Moeller worked as an equity analyst and was responsible for researching and rating companies in the economically sensitive automobile and housing industries for investment in Chancellor’s equity portfolio. Prior to joining Chancellor, Mr. Moeller was an Economist at Citibank from 1979 to 1984. He also analyzed pricing behavior in the metals industry for the Council on Wage and Price Stability in Washington, D.C. In 1999, Mr. Moeller received the award for most accurate forecast from the Forecasters' Club of New York. From 1990 to 1992 he was President of the New York Association for Business Economists. Mr. Moeller earned an M.B.A. in Finance from Fordham University, where he graduated in 1987. He holds a Bachelor of Arts in Economics from George Washington University.
More Economy in Brief


